Tuesday, October 31, 2006

Ingersoll Rand - Slight Correction


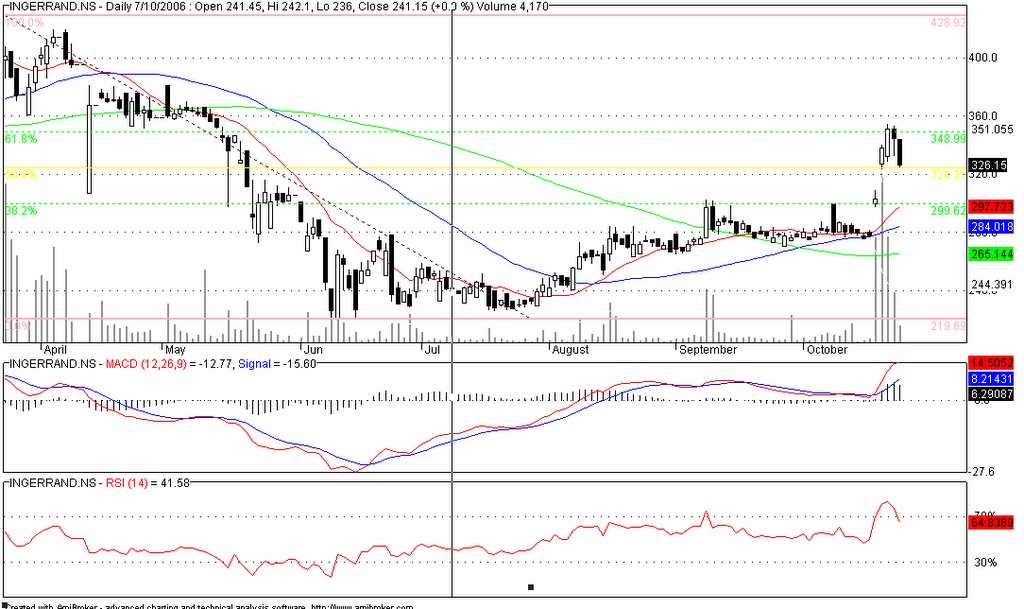
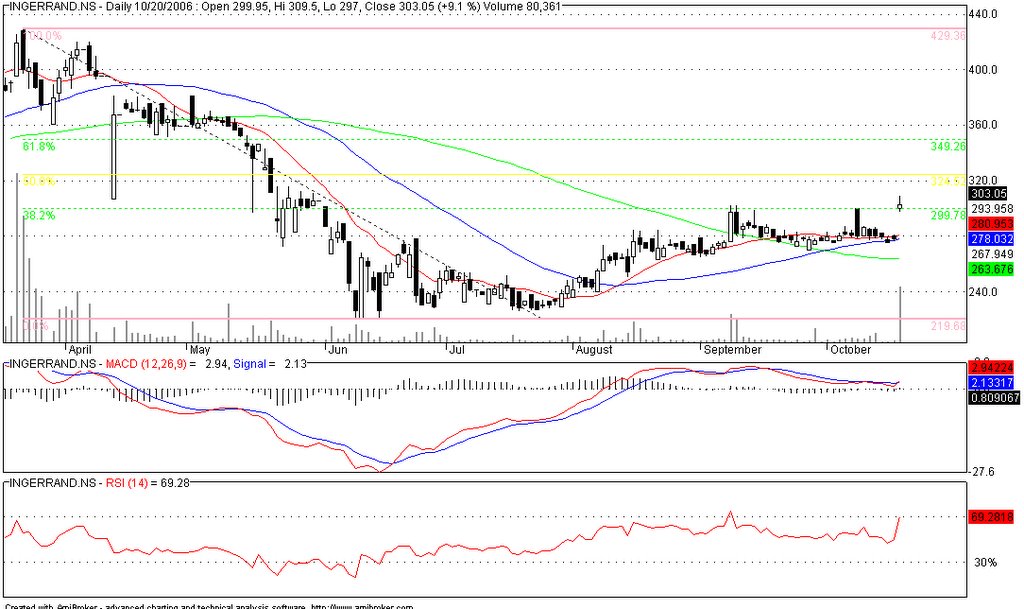
Ingersoll Rand has corrected by more than 8% from its previous high of 355 it achieved last week. The stock jumped too fast and with a few gaps in the process of this rally. The stock's correction looks like it is trying to cover some of the gaps created in the rally.
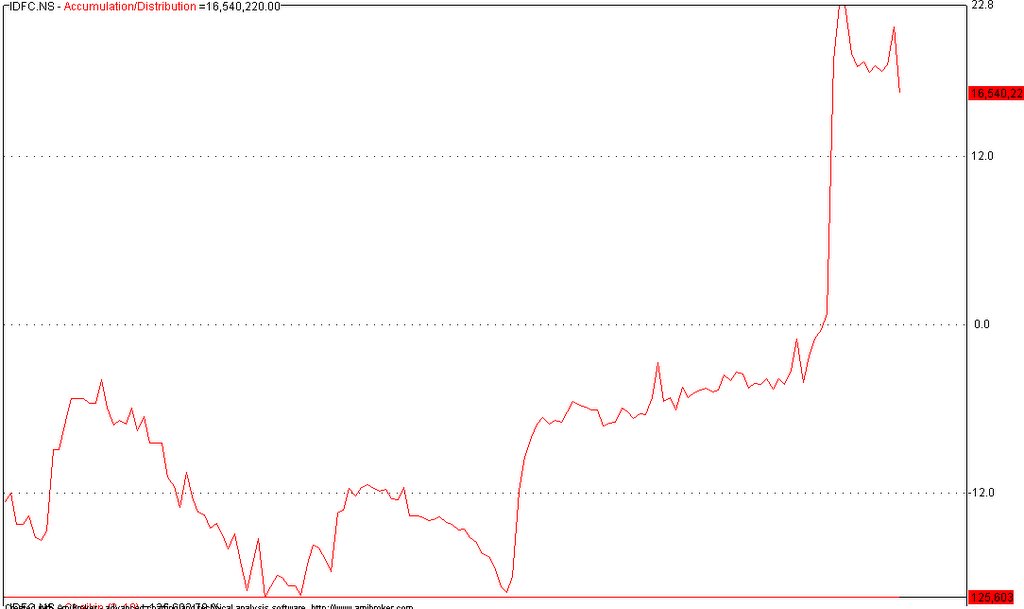
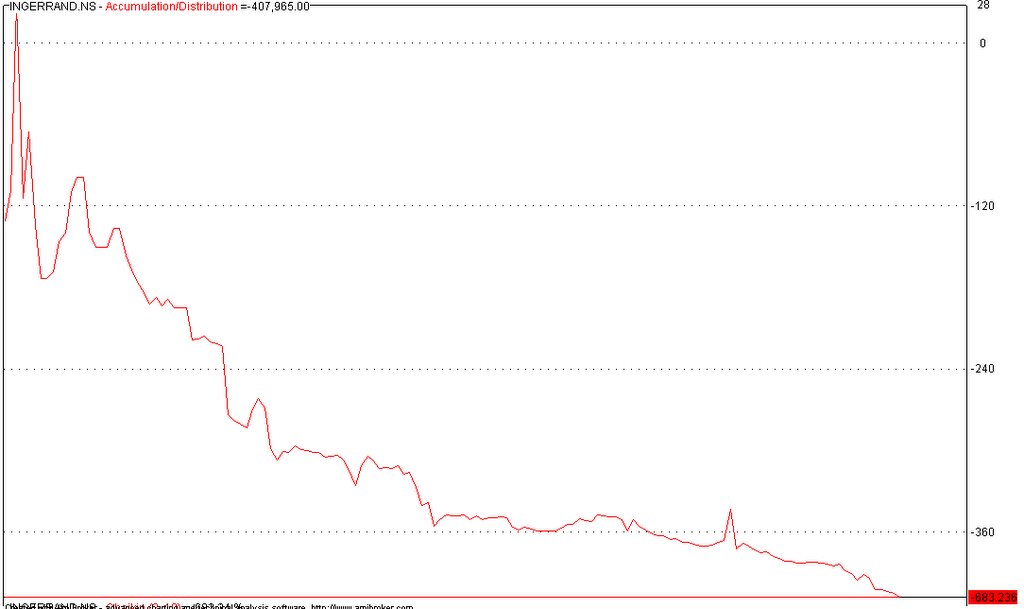
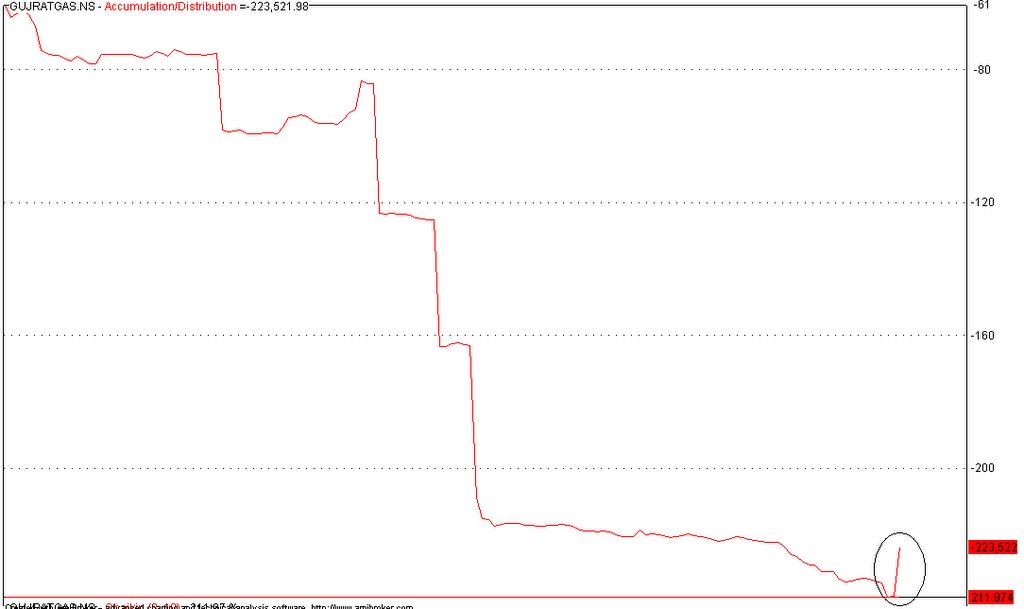
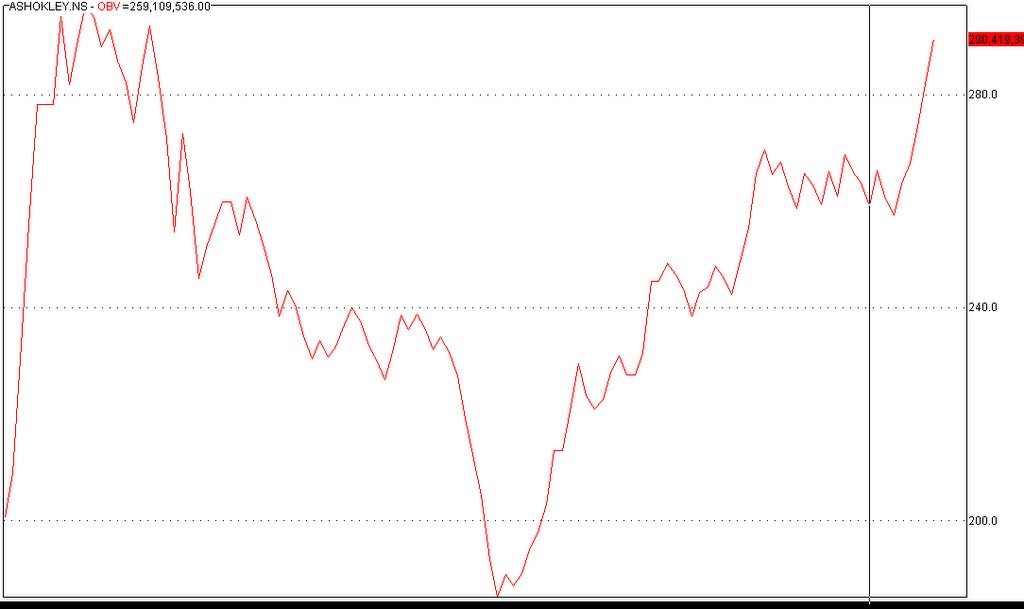
  • The stocks volume has not been too encouraging to define a proper correction in the stock. This is reflected in the movement in the Accumulation Distribution chart. The volume has reduced only marginally in the 8% correction.
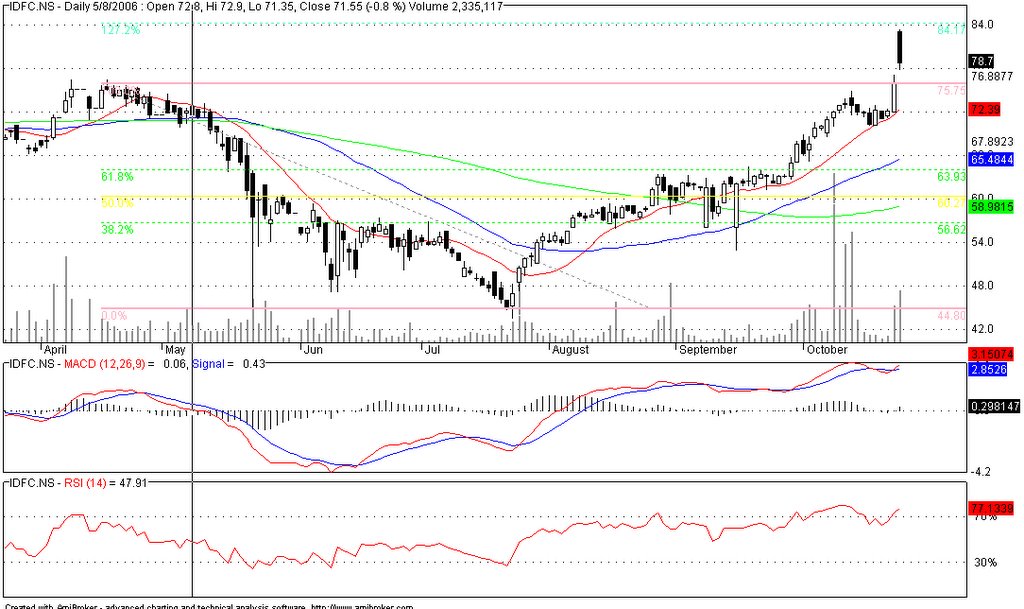
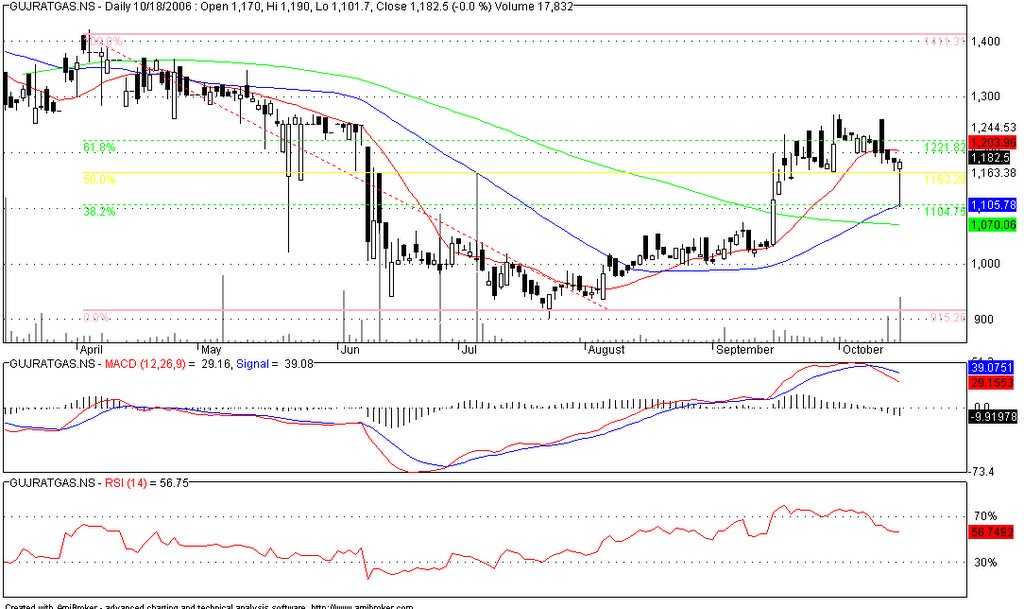
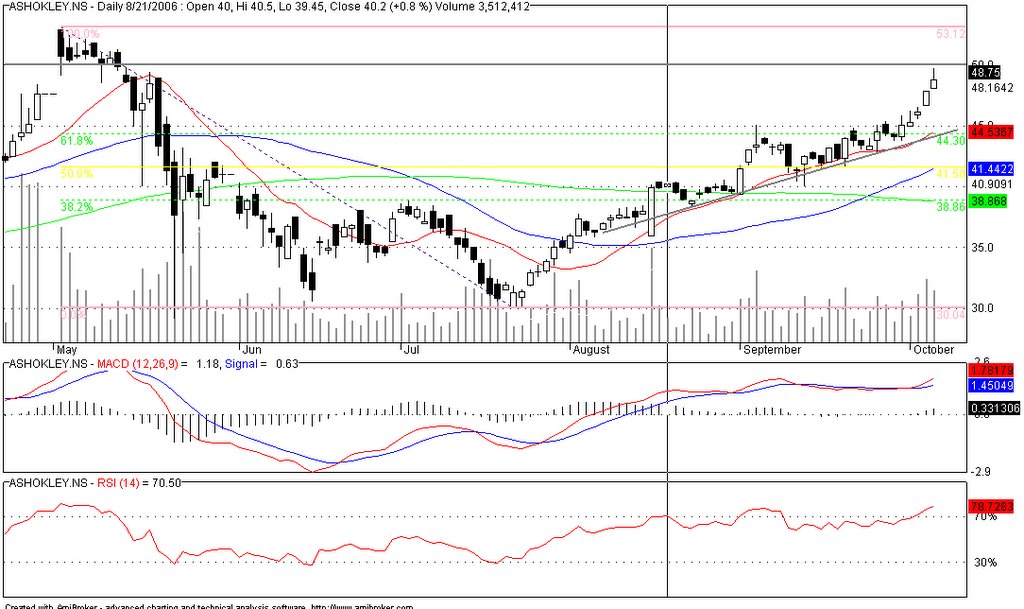
  • The MACD is also on a strong positive zone, though with this correction, it has still yet to give a 'sell' signal.
The stock has two immediate support levels. One is at 324 and the next is at 299-300. The stock has a strong upside of 387 as its first target and 428 with its second target. I am comfortable buying this stock at this current level and will look at this more as a small correction to the rapid jump in the stock price in the past week.

IDFC - Stock entering Resistance


IDFC is entering into its first significant resistance area in the near future. The stock has comfortably broke the 100% barrier last week. The next range in sight is the 127.2%. The stock was close to achieving it, before some correction took place intra-day in the stock.

  • The stock had opened with a gap today, and there is every possibility of that being closed. Hence the stock's immediate downside is at 76 from its current close at 78.
  • MACD is on a strong positive zone and the charts trigger line is on the 'buy' zone.
  • Volumes at which the 100% was broken is something heartening to see giving some strength to this movement. Accumulation and Distribution on this stock is strong.
Overall, from its current level, the stock has an immediate upside of 8% to 84 before the next signal can be given. Also, there is a small downside to the stock to 4% to 75 levels. A fair chance on the stock to move both sides on this stock.

Monday, October 23, 2006

Reliance Capital - Double H&S


Something strange to what one normally expects from my posts.

  • I saw this double Head and Shoulders formation in Reliance Capital. This is not a perfect formation as you would expect the time taken for the formation for a perfect on ranging for a few months and nearing the final formation of a bull market. Now, I do not see either of this happening in this stock. This is just a short term correction if it were to continue in the first place.
  • The other signals in the stock is no different from the view of a small bearish sign. MACD is still heading in similar direction
  • The stock is losing out on selling on the Accumulation Distribution chart.
Targets on this chart would be to wait till the stock waits Rs. 518 and then look at the direction of the stock. Given that the stock is a strong trading stock, a jump in the stock market's emotion on the stronger side can give a 'buy' at about 605-610.

Saturday, October 21, 2006

Ingersoll Rand - Breakout


Ingersoll Rand has been a slow mover in this segment of infrastructure companies. While the segment as a whole has underperformed, this company was even worse. The stock came out with its quarterly results which clearly stunned the market players. The stock immediately reacted to its news positively with a 9% jump. This stock has only now started its movement.
  • The MACD has started to move positive with a break of the bullish line over the correction line
  • RSI has reacted sharply and will need to check this closely as to not to over-react to the news
  • Given the sudden climb in the price, the Accumulation Distribution chart does not seem to factor the rise as the closing price was closer to the opening price. However, the stock has created a gap which will create a problem as this might need to get closed in the near future
Overall, the stock is currently positive and a good 'buy' strategy.

NDTV - False Breakout


NDTV has given a false breakout sometime early this week. The stock had jumped to 241 before reacting quite sharply. The volumes supporting this fall seems to be quite strong for the stock.
  • Accumulation Distribution chart shows the stock's volume increasing with a decline in price as a strong indicator of a false break-out
  • No major block/bulk deals was reported in the NSE/BSE. There is some strong selling happening across the board for this stock, a reaction from the quarterly results could be a reasonable explanation
  • MACD has given the first sign for a 'sell'
At its current price, the stock has got support level at 207 in the intermediate level. The next support is at 190 for the stock. If the stock breaks 207, I would wait for looking at the volumes till the stock breaks 200 and then take a position in the stock. However, the stock is a bit weak and while there is a small possibility of a small reaction upside, I would still wait as this section on its price chart, is normally on a congestion area for the stock as it never is able to decide on its direction. Overall, a false start for the stock!

Thursday, October 19, 2006

Gujarat Gas - Support Levels


Gujarat Gas has reached some support levels on its stock movement. The stock has been having a decent run in this market. Having crossed 61.8% comfortably, the stock looks to have lost some steam. Though the break from 61.8% did give some signals of movement on poor volumes, the stock currently is in between some support levels between 50% and 31.2% levels.
  • MACD is currently showing negative or a 'no buy' call
  • RSI though weak is still sliding down
  • Yesterday showed a sharp up-movement in the Accumulation/Distribution chart. It could be an effect of a block sale in this stock at lower levels.
Overall, the stock is a weak one, but accumulation at lower levels once there is some signal from MACD would be my call. If the stock breaks 1163 and goes to 1130 this stock will be bearish and could go down to Rs. 1104. However, the stock has an upside of Rs. 1220 on the higher side.

Tuesday, October 17, 2006

Bajaj Auto - Profit Booking


Bajaj looks like it is entering into a period of consolidation and there is some profit booking in this counter.
  • The OBV chart is giving the first indicator for this. The stock is seeing some active selling with more sellers in this market.
  • The stock is nearing its complete reversal from the huge fall in May
  • RSI has reached its limits and there is a general correction on this stock when it reaches that level
The stock at this level is offering little incentive for the risk for a higher upside. With a first correction expected at its 100% level, which is just another Rs. 100 away from its high of 3227 from its current level of 3104, I would like to book my profits in this counter.

Sunday, October 15, 2006

NDTV - Price Breakout


NDTV looks like there is a possible price break out. The stock has had a good correction from Rs 280 to less than 130 before the stock saw some upside.
  • The stock has currently broken the crucial 61.8% level at some really convincing volumes
  • MACD chart has given a 'buy' signal but RSI is on a 'sell' side.
  • The OBV chart is showing some strong buy in this stock
Overall, given the recent breakout, I would start with some exposure on this stock, but a small one to test the strength on the continuity of this rally in this stock. But caution still prevails before buying the stock.

Thursday, October 12, 2006

HCL - Stronger Case of an Upside


HCL Technologies has been one of the few IT companies that has not participated in this rally as much as one would expect from a top IT firm.
  • MACD crossover just happened yesterday.
  • The price has broken the intermeidate 61.8% fibonacci series by over 3% to Rs. 580, confirming a possible upside to this movement.
  • RSI was largely benefited by the recent two days rally in the stock.
  • The only exciting part of this stock comes from the OBV chart. The stock has seen a large amount of selling and we have almost a completely new set of investors in this stock. Right from mid April, the stock has seen greater amount of people selling in this stock rather than buying. The stock is approximately 10% discount to that price. However, for the same price the stock some strong declines in the OBV chart.
Given the nature of this movement in the Tech Sector, there looks to be an opportunity to be made in HCL. However, caution would certainly be an important element.

HLL Channel Support


HLL just broke a channel support.
  • The trendline on the lower side has just been broken.
  • The volumes at which it has broken is on an extremely high side. This is a signal of a strong weakness in the stock.
  • MACD's column bars are increasing, indicating the weakness in the stock and also some sign of bearishness.
  • RSI is on lower side, mainly due to the recent correction in the stock.
Nothing exciting happening in this stock and looks likes some more bearishness still to come. But an ideal stock to watch in the near term.

Wednesday, October 11, 2006

Chennai Petroleum- Support


Chennai Petroleum has entered into a strong support zone in this otherwise selective bull market. The following are some of the reasons on the technical side for this chart to look at a 'buy' or 'hold'.
  • The stock has recently corrected from a high of Rs. 240 to current levels of Rs.200. While the stock has witnessed strong sales backed with volumes, the recent fall within this indicates that there is a certain amount of value buying in this stock. The stock's recent correction from Rs 210 to its current levels has seen a volume increase in the buying of shares.
  • MACD is on the negative side and has just broken into the negative zone, indicating some bearishness in the stock.
  • The RSI is in a strong foothold at 40, indicating the stock not being an 'oversold' stock.

Overall, a correction in this stock would take it to somewhere between 180 and 190 and a strong run in this stock will take it to Rs. 220.

Saturday, October 07, 2006

Havells


There was a big block deal yesterday which caught my attention. The stock has been hovering at around 270-290 range for sometime before a recent spurt in prices by approximately 15% . I just checked if it makes sense to take a decision on this stock.

  • The MACD showed the jump that was expected in this movement. It is also increasing giving an indication of some strength.
  • RSI has jumped to more than 70 - sign of weakness but there is an indication in the past that the stock can rally for some sustained period inspite of being in the higher side (if one looks at April-May)


The stock jumped on the block deal that happened two days back. The price at which it was struck is at 301.5 well below the current price of 332.

The stock has been a good player in the infrastructure segment, a segment that has not rallied closely with the index. However, the stock has reached where it has just broken its 61.8% levels of the great fall in May. The current upside in the stock is around 10% to reach its next resistance levels. So, you have the prices on hand now. A possible upside to 370 and possible downside to 298-300.

Friday, October 06, 2006

Ashok Leyland - Inching closer to target


Ashok Leyland seems to be inching closer to its previous high, which is just about 10% lower than its high in May. The stock has a small resistance at these levels which happened in the month of May.
  • RSI is in a strong overbought position and it has remained so since the past one and a half months.
  • MACD lines have widened a little in the past couple of days. So that gives some sanity to this rally.
  • OBV chart is showing a singular good run indicating strength.
While these indicators do seem to point that there are still a few investors who are believing there is strength in the stock, I would like to see any bulk/block sales from a financial institution as a strong sell immediately. Morgan Stanley had given a target of approximately Rs. 50 earlier and that could be the range that I would closely look at to start any changes in the portfolio.

Glenmark - Chart wonder


Glenmark is a wonderful chart for any chartist. The stock has broken 333 levels for quite sometime and gave some indication of some serious support levels. Post the news on the company, look at the steep fall. It has broken the 50% quite comfortably and inspite of todays fall, this has not been quite steep.

  • MACD is deep in the red but the column bars has remained the same as of last time.
  • RSI is super comfort zone
  • During the entire fall in this rally, look at the strong OBV line in the next chart. Unlike other companies, where OBV volumes had accompanied the fall, this chart has remained extremely strong. The volumes are still in positive zone. Two important reasons could be that the shareholders are not believing the news and hope to subside or resolved and the other could be that these investors are for the long term of the stock given the growth prospectus. Either way, it looks attractive.
While I do not track this stock closely, what I liked in the stock was the OBV signal, RSI and the stop at the resistance. It could be a short stop for an even further fall, given the bad news for the company. However, this stock is a risk takers delight.

Wednesday, October 04, 2006

Gammon - Time to move on


Gammon has been one stock that has been quite unimpressive in this rally. The stock has not convincingly broken 38.2% of its fall from its high of 575 in April to 287 in late July. Some of the other interesting stuff in this chart.
  • MACD is showing some indicator. The two lines have broken with one another.
  • RSI in comfortable zone with no indication from them. However, there is some divergence with the MACD chart.
  • The other positive signal in the chart is the OBV section. The stock has seen some heavy selling. It is still in negative zone, indicating that a rise in price can be a sustained one, if it occurs in the near future.

Tuesday, October 03, 2006

Tata Motors - Stock to Watch


The stock fell hard during the month of May from 980 to about 640. It reacted back before falling back to its previous low in July. Post this, the stock has had a tremendous rally and reacted back to move past its 61.8% levels of its previous fall to 900. The stock has now corrected by just more than 5%.
  • MACD charts has shown the decreasing column bars and the gap reducing between the 9 day and 26-12 day chart.
  • RSI is still at a comfortable zone, though not in a clear buy zone.
  • The interesting formation is in the OBV segment. From the start of the triangle, look at the OBV chart. The price of the share has fallen, however, there is an increasing trend in its accumulation of shares.
Though couple of signals are nowhere near a 'buy', I still like the chart for the OBV segment. Also the numbers which it has shown for the month is equally impressive. Click below to the article.

Tata Motors Sept vehicle sales up 24 pct

Happy investing