NDTV - False Breakout


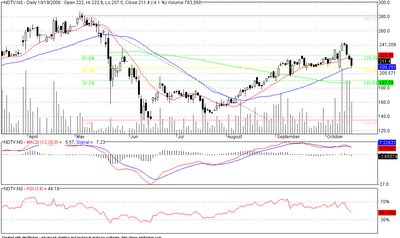
NDTV has given a false breakout sometime early this week. The stock had jumped to 241 before reacting quite sharply. The volumes supporting this fall seems to be quite strong for the stock.
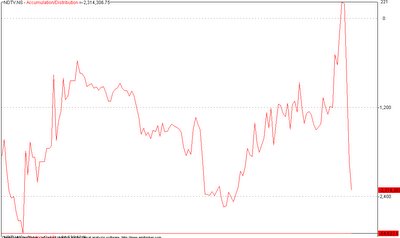
- Accumulation Distribution chart shows the stock's volume increasing with a decline in price as a strong indicator of a false break-out
- No major block/bulk deals was reported in the NSE/BSE. There is some strong selling happening across the board for this stock, a reaction from the quarterly results could be a reasonable explanation
- MACD has given the first sign for a 'sell'

0 Comments:
Post a Comment
<< Home