Monday, July 24, 2006

Ashok Leyland- Exposure with Caution

Ashok Leyland has entered into an interesting phase for the following

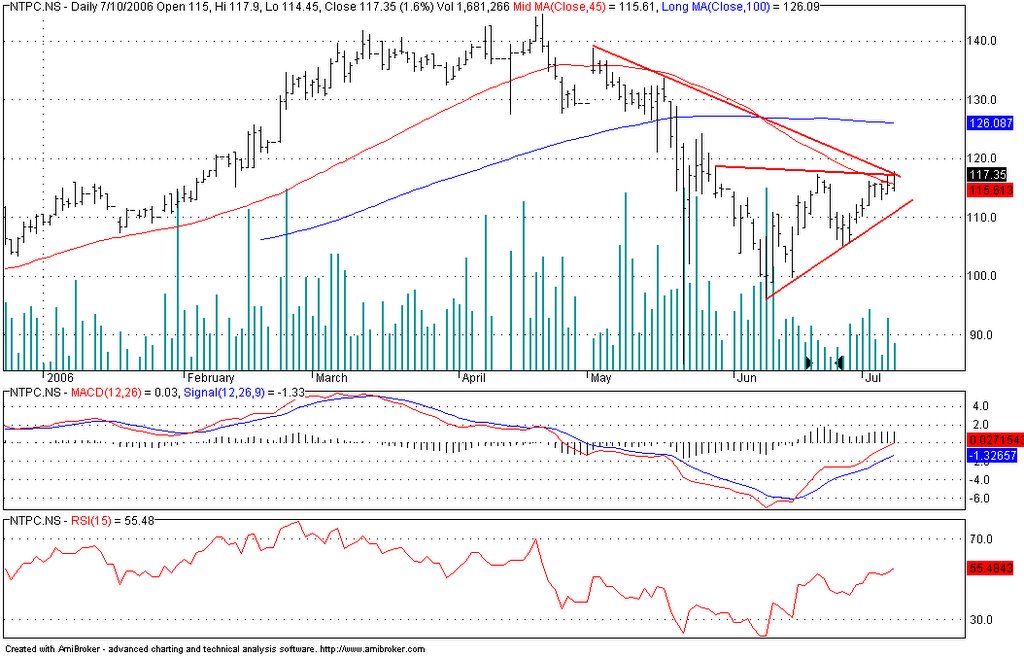
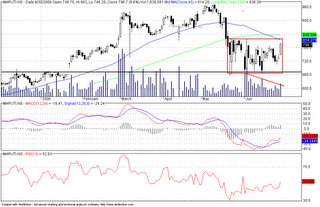
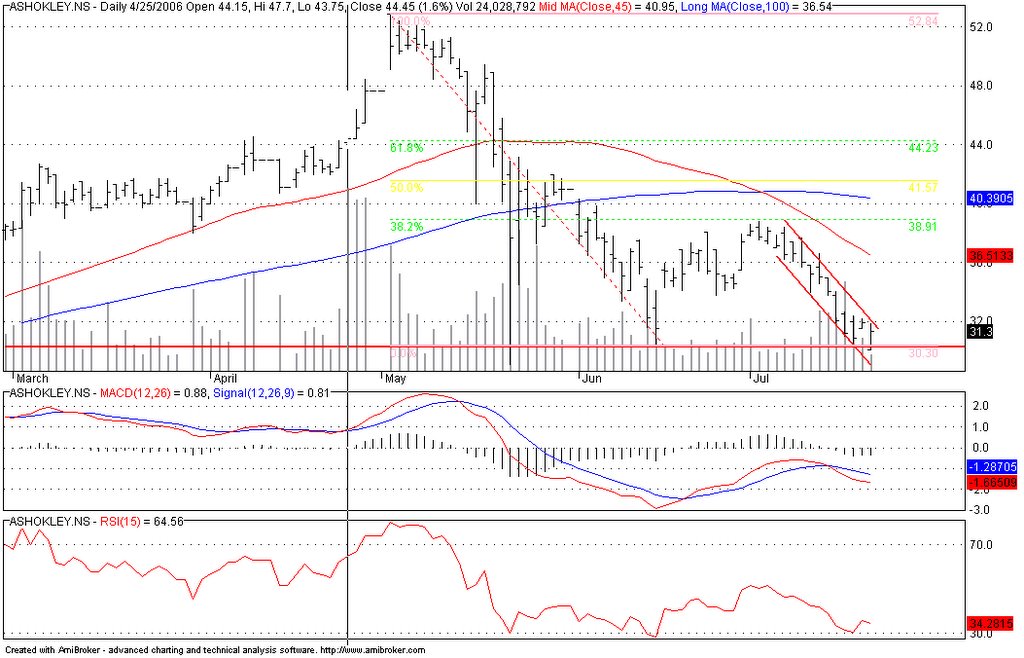
  • It has almost reached its lows after the crash of May. At 29, it would touch these levels. Even the channels indicate this as a strong probability.
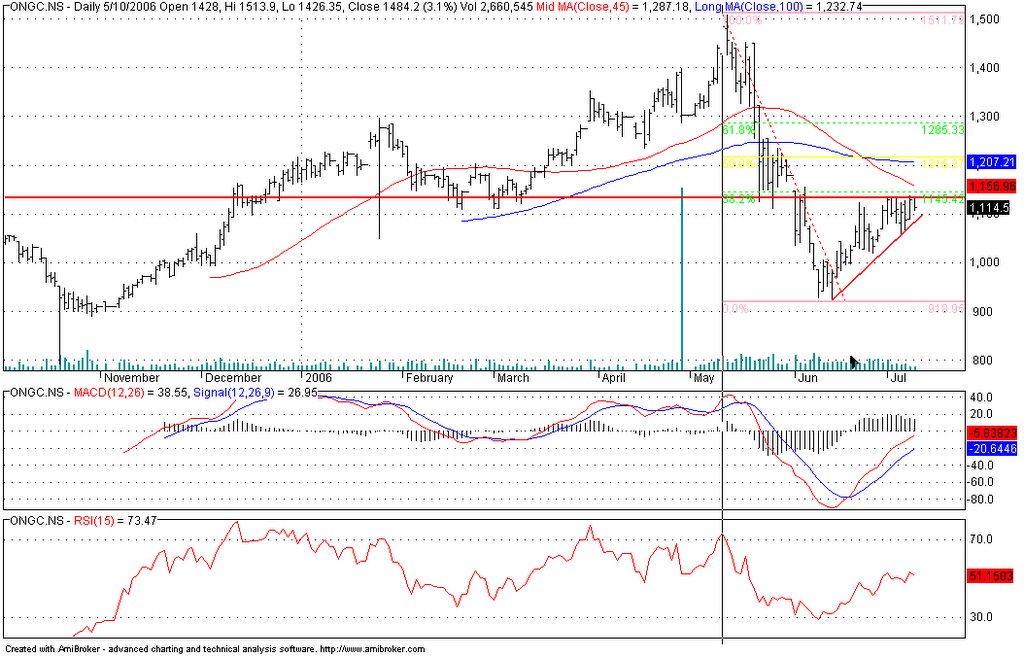
  • On a fibonacci chart, the stock retraced to 38.91% before retracting again back to these levels to 31.
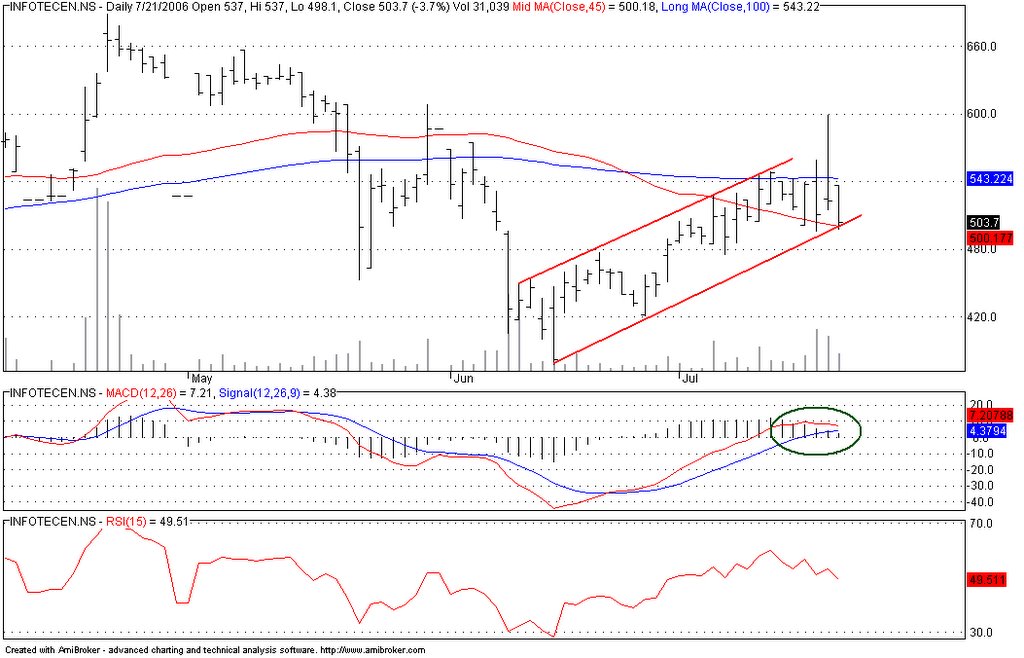
  • The MACD chart has reduced the divergence between the 9 day EMA and the 12-26 day EMA.
While the above two is yet to be conclusive to rate a proper 'buy' conservative investors could probably wait to see a proper turnaround in the prices wheras the risky investors can start accumulating this stock. The only caution for the safe investors is that the stock sees dramatic turnarounds of more than 8% in a day.

Infotech Enterprises - Book Profits


Infotech Enterprises has entered into the channel of Rs. 70 margin. It is currently trading at Rs. 503.

  • The MACD has shown a decline over the past few days as indicated above. While the convergence of the upper line is yet to occur with the lower line or the 9 day moving average indicator, there are signs that it would happen from the vertical bars given by its decrease in margins.
  • The RSI is confirming this downtrend as with the OBV given in the lower chart.
The above charts give indications of booking profits in the stock. It is a bit early to define this decline as a proper downtrend. However, any further decline to 485 can be given a 'sell' signal. The stock can fall to 450 after that.

Thursday, July 13, 2006

ONGC - Time to book profits


  • ONGC has moved into a zone where the resistance level has crept in. The stock has rallied from 920 to its current levels of 1120.
  • Volumes have started to reduce. This is reflected in the OBV chart.
  • Though RSI is in a comfortable position, the MACD histogram has started to show slight divergence to its lines.
  • Long term too, there is a strong resistance lines in the stock at this current level.
Hence, the call to book profits on this stock at this point in time.

Wednesday, July 12, 2006

NTPC- Holding on


The stock still looks positive amongst most of the other stocks that I have seen over the past few days. The stock has fallen on low volumes and is rising on higher volumes. A strength of a good stock. For investors who are itchy to buy a new stock, this stock looks the best.

Tuesday, July 11, 2006

IOB - Triangle Development


  • In my previous article, I had mentioned that IOB was heading nowhere. The triangle on the lower trendline has been broken yesterday. However, this movement was not accompanied by volumes. Hence, for existing investors, this still does not look good. I would still prefer at looking at other stocks and look at this stock back at 86 levels, if the movement is strong. There is a lot of resistance that the stock is facing from the fibonacci point of view too as the stock is shown in the figure.
  • For fresh investors, this stock will be a 'no', as the stock is trading on extremely low volumes. The stock has moved from its low of 65 to the current levels at 81, on very little volumes. This is represented in the OBV chart.

Monday, July 10, 2006

IOB - Heading Nowhere


I have attached three charts on IOB.
  • The first chart is the short term chart. The stock entered into a symetrical triangle and is not breaking significantly in any direction.
  • The volumes on this chart is flat. Every rise is on extremely low additional purchases. The stock has moved from 65 last month to 83 this month with hardly any movement in OBV. This is not a good sign on the stock.
  • The two lines on the MACD has shown some convergence which is not a good indicator, as the stock has seen a significant rally in the past.
  • The medium chart also gives indication of resistance at 89-93.
Given the above condition, I would suggest a 'sell' for the existing holders and move on to other companies and a 'no' for investors who want to enter the stock afresh.

Sunday, July 09, 2006

NTPC - Hold for some more time


  • NTPC is still is looking strong on the charts. An upwards sloping triangle with volumes inside the triangle being on the lower side is a strong indicator of it confirming to this triangle
  • The MACD has still not given any signal for a change in strategy and the RSI is moving witht the trend and is at the mid-range at 53.01
  • Volumes are confirming with the price movement with every rise getting more purchases than in every fall
  • Nothing conclusive on the fibonacci charts on this movement
Overall, there is some strength in this rally. A key factor to decide on selling would be it breaking 106-105 on the downside with strong volumes and the stock will see resistance at 114 and 120. However if it breaks these levels.

Friday, July 07, 2006

IDFC - Update

Hi,
The stock still seems to be moving sideways and there are concerns on that stock. It has to break 59 as the stock has strong resistance at that level.

  • The stock tried to penetrate the triangle twice, but has failed on both attempts.
  • MACD is still positive but the RSI has been moving sideways for the past two weeks.
  • The OBV has fallen drastically and there was some heavy selling going on that stock as mentioned in the previous mail. This indicator has moved into the negative category, indicating a lot of old buyers moving out of this stock.
Overall the stock does not seems to be in a hurry to move upwards and there is time to take position on this stock.

The stock has not changed much and I have not added a new chart. The old chart is available at
http://knowcharts.blogspot.com/2006/07/idfc.html

GAIL - Danger Signs


GAIL has given the following indications which are contradictory to one another.

  • RSI is moving sideways which is confirming with the price movement.
  • MACD is still on positive zone.
  • The stock is nearing its strong resistance zone at 269 which has been tested on multiple occasions since December.
  • OBV, a sign of the strength of purchases has been reducing from last year. A lot more selling is happening than accumulation on the stock.
Overall, it does not look like a good sign on the stock.

Arvind Mills - Seeing the Light


Arvind Mills, has broken the symetrical triange and has moved updwards. Technically a few positives in the move.

  • MACD has moved into a stronger zone.
  • RSI is not showing any divergence from the current movement of price.
  • OBV is showing a growing interest in accumulating the stock
Overall, this is a good sign for the stock and time to enjoy the gains of the stock.

Wednesday, July 05, 2006

Arvind Mills - Will it see the Light


Arvind Mills, after having bottomed at 52, has started to look back. The following are things that needs to be looked at in the near future.

  • This stock too has formed a near symetrical triangle. The stock is moving in a nice range for the past month. The MACD has shown a positive divergence and the RSI is also in a comfortable zone.
  • The stock's volume is giving an indication of a 'wait and approach'. The volumes are falling in this movement.
Given the huge fall in volumes over the past few days in the NSE, I would suggest to wait before taking an exposure in this segment.

This call too remains inconclusive because of the inherent formation of the chart. Let me work on others to see where we can invest our money.

Maruti- A congestion that is waiting for a signal


The past few days of mine has been mainly spent on understanding technicals of a stock, or in other words, identifying patterns that shall give us some indication of future trends. Above is the stock of Maruti.

It has given two important indicators to the market.
  • The stock has touched the resistance levels of December, which is now the support levels for the stock. This is a good sign to decide on the current downside for the stock.
  • The stock has to break out from the box by atleast 3% to create an upside for the stock. This was because of a period of consolidation that it created in the month of February. The stocks resistance levels has been given in the fibonacci series. Also I am shall be concerned at the levels of 840 too as this was the previous support line in the middle of March.
Lets see how the stock pans out in the near future...

IDFC


IDFC has entered into a symetrical triangle. This type of triangles are normally not indicative of the future trend until there is a clear breakout. The stock did a low of 45 on May 22 and then has entered into this triangle and since then RSI has shown some strength. As this does not take the volume under consideration, I have used the OBV indicator to define the strength of this movement within the triangle.

Also if one looks at the OBV, which is a volume indicator, it is pretty disappointing. The stock is seeing movement on reducing volumes... Buying has drastically reduced in this stock and infact is losing strength. At this point I would be a bit hesitant to take calls on the stock.

Lets see how this stock pans out in the near future.