Friday, December 29, 2006

NDTV - Now Known!


NDTV had an amazing rally in the past couple of days. Having discussed this stock a couple of days back, this stock has broken some of the targets that was discussed last time. Moving on some specific issues in this movement.
  • Volumes are still strong but the accumulation and distribution chart is showing some divergence to the current movement of price. The stock has been at 232-235 for two days now and the chart is showing some profit booking in the stock. However, the momentum looks to be still favoring a strong move as the decline was extremely small.
  • MACD is on the 'buy' zone but RSI is rocking upwards given the strong price movement in the past couple of days.
  • The stock has just broken the 200 day moving average.
The stock today has an upside potential of another 8% to 250. The next target would be at 280 if it breaks Rs. 250 mark comfortably. I would be concerned of the downside from here given the recent price movement of more than 20% in such a stock. Rs.224 would be a crucial number as it would be at 50% levels and would again break the 200 day average.

Sunday, December 24, 2006

NDTV - Known Unknown


NDTV was a stock that I had picked up when the stock had fallen to Rs. 195. The stock infact fell a little further before the recovery on the stock had started. The stock is now trading at about Rs. 215 and the stock looks like it is going to give some upside even now.

Reasons could be
  • MACD lines are just about converging and the possibility of getting a 'buy' in this stock looks possible.
  • RSI, inspite of this strong rally, is still in a comfortable range at 40s.
  • The biggest positive in this is the volumes. They are extremely strong on the accumulation distribution chart.
  • Stock has comfortably broken the 207 mark and infact is trading 3% above that.
This was a stock that I picked up mainly from Businees Standard. They had given a put call ratio for the stock at less than .02 when the total put call of the market was somewhere at .4 to .6. Given that the outstanding position in this stock was increasing, this looked like a safe bet to me. Looks like it was good at the end.

My targets for the stock would be somewhere at Rs 224 on the upside. Breaking this, would also mean that the stock would break 200 day average which is a very good sign for the stock. Downside, I would look at Rs. 207 and back to 190 closely.

Tuesday, December 19, 2006

Bajaj Hindustan - Interesting Stock


Bajaj Hindustan had a good start today before losing during the end of the day. The stock was up 7% intraday and there was profit booking at the latter half. The stock is interesting with the recent news of sugar exports ban being lifted for companies with export obligations. There was a good run in most sugar companies but then the market was too pessimistic to factor the news. So, this gives a good opportunity to buy the stock.

  • The stock saw some good volumes today but the accumulation distribution chart is yet to give a buy signal.
  • There is an almost 'buy' signal from the bullish line from the MACD chart. Still not a clear signal emerging fromt the stock.
  • RSI is on a safer zone and hence the downside looks limited in this stock.
  • The stock price is at the bottom of the channel formation and historically the stock has seen some bounceback from the bottom of the channel. However, this did not occur the last time, a small concern for the stock. However, the information currently on the lifting of exports can do more good than harm for the stock.
The stock can bounce from these levels and is a decent 'accumulate' at these levels.
With the stock currently at Rs. 228, the upside for the stock is currently at Rs. 295-300, giving an upside of about 30%. However, given the underlying bearishness in the market, I would like to look at the speed of the stock movement at Rs. 240 and then further again at Rs. 280. Downside is difficult to predict and if it falls below Rs. 200, then one can start selling the stock.

BHEL - Technical Update


Looks like this stock was in a hurry to move somewhere down ! The stock as predicted yesterday had some weakness and preferred the downside rather than the upside. Jokes apart, some of the key features in today's movement

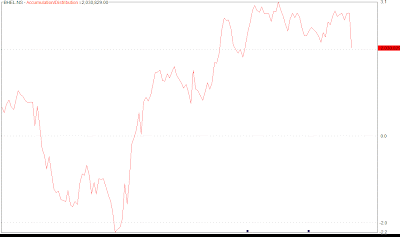
  • The volumes as indicated in the Accumulation Distribution chart showed some strength for the downside and today was no exception to it. CNBC did not have any strong reason for this fall and I too am not able fathom such immediate downside. The sheer volume in today's transaction was too hot to handle for this stock
  • As mentioned yesterday, this stock had some support at Rs. 2250 and the stock hit 2260 before closing at Rs. 2291. Not a bad support level!
  • MACD is still on the 'sell' side, though RSI has close to reached levels of 30, a decent level to buy this stock
What to expect of this stock now?
The stock has now convincingly broken the 200 day average, 100 day average and almost all the averages. Triggers for a buy would be somewhere at Rs. 2340-2370. I would like the upper one as this downside trigger should be sustained with a higher strength in the upside rally. Downside for this stock would be at Rs. 2115. If it breaks this tomorrow or in the coming few days, then one can look at Rs. 2020 as the next support point.

Monday, December 18, 2006

BHEL - Technical Update


BHEL is entering into a nice support zone. A few points for consideration
  • The stock has just broken 200 day average in this downfall. Not a good sign for the stock as it normally triggers a 'sell'
  • The current zone was a tough one to break last time when it wanted to move upwards as has been highlighted in the box.
  • MACD is still on the sell side and the RSI is just about inching towards a safe zone.
  • The volumes as indicated in the Accumulation Distribution chart shows a a spurt in selling in this downfall
Looking at all these signals, one should look at this stock with caution and not enter in a hurry with this correction. On a fundamental basis, this stock is slightly stretched and though this has a clear advantage with its products, new entrants from China esp. can create some downside pressure.

I would look at this current levels of support and if it is breaches convincingly one needs to take a call on the stock. Downside targets would be, if it breaches 2350 it will see the next resistance in the range of 2250. On the upside, if it breaches 2500, then the target would be at 2650.

Ashok Leyland - Target Achieved


After a good break, I am back with the technical charts. We had some really interesting formation on the charts in the recent correction! Fibonacci did help in some of them and failed in the others. Anyways, the beauty of technical charts is to observe support and resistance movement in the stock and take intelligent decisions. Ashok Leyland was one of the stock that did a good work in the technical side.

  • The stock fell from a high of Rs. 50 to Rs.38.11, a level which is at 61.8% levels. The stock bounced from these levels to 38.2% and is now at a resistance point
  • The stock is below its 200 day average and is shy by about 5%
  • Volumes on the Accumulation and Distribution chart is yet to give a convincing signal
Overall, if you have made the purchase of this stock in the recent fall you can start booking profits. Fresh exposure in this stock can be taken after it breaches the 44.40. Fundamentally too, this stock has some strength and would be a decent long term investment!