Tuesday, September 26, 2006

PTC - Entering into Support Zone


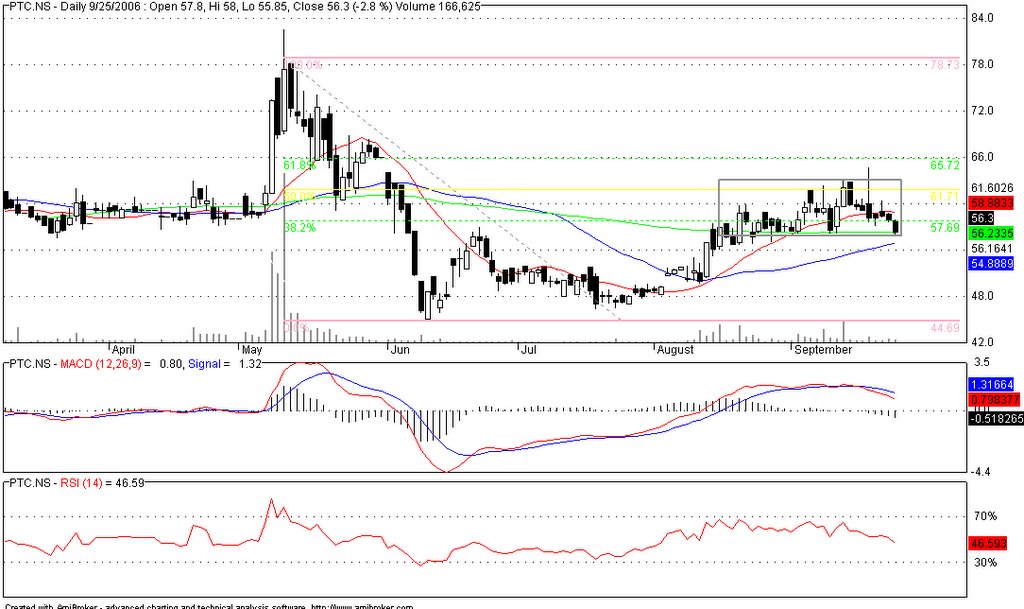
PTC is entering into support zone at these current levels as shown in the picture above. From a high of Rs. 82 in May, the stock corrected quite sharply to a low of Rs. 45 in June. The stock has subsequently rallied to a high of Rs. 65 before correcting back to current levels of Rs. 56.
  • The stock is currently playing between Rs. 55 to Rs. 60 range.
  • MACD is on a sell signal and with an increasing bar columns, indicating some weakness.
  • RSI is close to a very comfortable zone at 46.
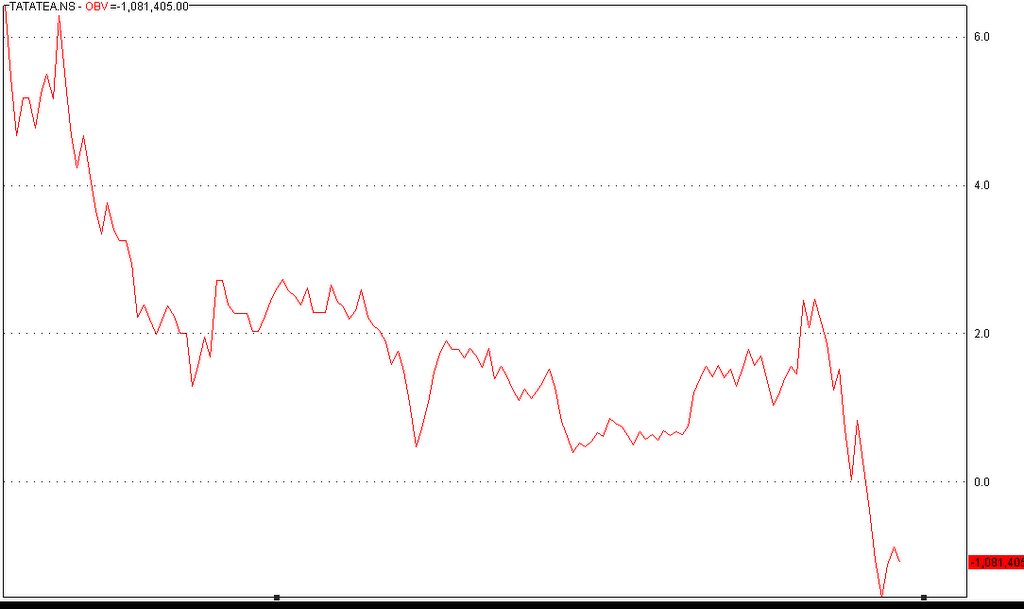
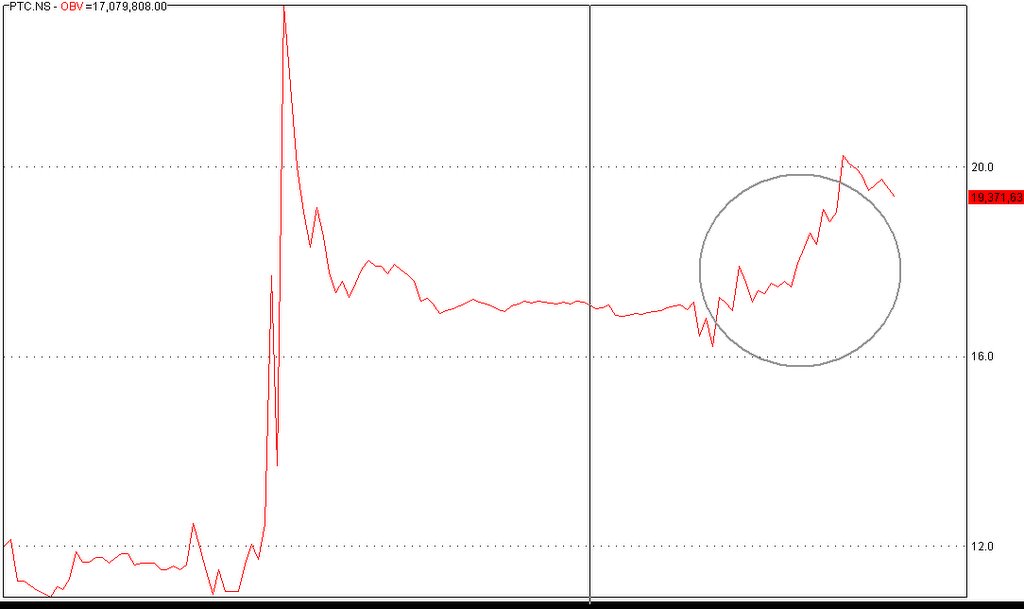
  • The OBV indicator is a good leading indicator for this company at these levels. In the trading zone, that has been marked with a rectangle, look at the corresponding circle in the OBV chart. There has been significant amount of purchases at that zone.
  • The stock is currently at a strong zone even without the rectangle in consideration. The stock was in this zone from December to May before the huge break-out.
While, there is some strength shown in this stock at this level, the only concern shown will be with the MACD indicator, that is declining. However one can start accumulating this stock slowly at these levels or wait for a definite break-out which could be after Rs. 67 and a possible upside at Rs. 78. However, this would require the market to be extremely bullish which I do not see currently.

SBI- Caution Ahead

SBI has not followed a fibonacci series in the rally that has occured till date. Though it has had a small correction when it retracted 61.8% of its previous levels, it still has remained a very strong stock. However, the following are some patterns that are showing which gives some signal on weakness in its recent price movement.
  • It has retracted a full 100% from its previous high of 995. There is some distribution of stock happening at these levels.
  • MACD has given its first sign of convergence. With a clean movement on one side, the stock has shown some negative movement.
  • RSI has shown the stock in a overbought state a few weeks back. It is currently at 65 and falling.
Given the above parameters, I would recommend a 'sell' in this counter and wait for some correction or a clear upside in the stock. Any upside from 1030 will be a decent bet to start accumulating. However, the stock poses a higher risk of downside than upside.

Saturday, September 23, 2006

Patni Computers - Correction for the next rally


Though this is a stock I have normally avoided, the chart is something that was interesting.
  • The stock had a month long wayward movement in the month of May. It finally broke on the downside and fell to 248 before it started its stellar movement. The stock again found this 345-375 range extremely difficult to break. It did break couple of weeks back before correcting back to this level. This time the stock is at a support point.
  • MACD - is negative the bars have been on an ever increase in height.
  • RSI has been falling and is in lines with its peers of Infosys, Wipro and TCS.
This stock has entered into a correction phase. It can fall back to 375. The only downside that I see in this stock is that profit making is quite difficult unless one is there in the stock before it rallies. The stock jumps quite quick. So, this is a stock that has the potential. Enter with caution and personally I would wait for a few more days before I take an exposure into this.

Bajaj Auto - Breaking Away


Bajaj Auto has closed today at 2916. There are some reasons to start taking an active look at this stock.
  • On a fibonacci chart, the stock has retraced 61.8% of its previous levels. It has broken this level for the first time after reaching close to it 4 times in the past 4 months. The breakout today has occured on strong volumes. An indication of some strength in the stock
  • The volume chart from OBV has been on an upside.
  • However, for the stock to move from this level would be difficult as the RSI indicator is in the mid 60s. So there is a strong possibility of the stock to correct back to probably 2860 before an upside target of 2995 and the next level at 3250.
However, the movement today is something that I have been waiting to see from this stock. I would wait for another couple of days unless there is some strong buying happening in this segment. Again, given the indices in most countries correcting and Indian P/E becoming extremely expensive, I think there is sometime for the stock to reach higher levels.

Thursday, September 21, 2006

IT Companies - Following Different Returns

Infosys, TCS and Wipro are following different price charts in this rally.

Infosys has had a significant run in the past few weeks. The stock fell around 25% from its height of 1701 to 1224 before showing a strong rally to more than 1830. The strength over the past few weeks has been pretty low. However, the stock has strength to go past 2000 on the basis of the expected guidelines that it has given for the current year. However, it looks like the stock has time to get to those levels. On RSI charts, it is still not expensive. But as it goes, there looks like other charts to look at than buying this stock. Owners of this stock can hold it, with a little correction coming in the next correction in the market as it is followed by many analysts.

TCS is following close to Infosys. The stock has retraced the entire losses, of approximately 25%, that it gave to its investors :) in the recent crash. In terms of growth from these levels, there is a potential for it to follow the path of Infosys. RSI is slightly expensive than Wipro, but no definite signals from MACD. Even though MACD is not showing any signals, the OBV indicator is strong with purchases happening with every small correction. If it has to follow Infosys then there is an upside of 25% in the stock from current levels.


Wipro has been a laggard when compared to TCS and Infosys. The potential for further upside looks far more attractive on purely relative terms. The stock fell from a high of 592 to 375 before it retracted to 61.8% levels to 509. The stock is howering at that levels since end of June. The stock can give a potential upside of 20% with a downside support at 480. With respect to signals from other charts, MACD is showing first signs of divergence between column bars and the trend line. RSI is on a comfortable zone.

Sunday, September 17, 2006

Tata Tea - Confusing Signals


I dont like what I am currently seeing in Tata Tea. A lot of mixed signals.
  1. The OBV is on the negative side indicating that most of the existing shareholders have changed in the past few months or the older shareholders are selling it in this rally.
  2. The price chart indicates that it has reached its support levels and the next price will be determined by the next set of movement, whether up or down. If it falls below 740 on decent volumes, the stock is weak and one get out of it. A price above Rs.790 is bullish on this stock.
  3. The recent news on Tatas increasing their stake by diluting shareholders equity was a dampener. I would have wished they increase by buying out existing shareholders than an issue of fresh stock.
  4. The recent news from Tata Coffee and its own purchase of bottled water is the only good news. These purchases will take time to show in their books.
Stock is at a nice time!! Enjoy investing

Friday, September 15, 2006

Hindustan Zinc - Divergence


The divergence between the rational and the irrational seems to be showing slowly in the market. a classic example of this case would be in Hindustan Zinc. A stock, which has always been my favorite in the metal segment, mainly because of volatality and a strong co-relation to international prices. Having seen this occuring in the past, I prefer LME to give me a cue on the price movement in Indian markets. The prices in the London Metal Exchange has fallen from its high of approximately 3650 to 3250, a fall of roughly 11%. However, over the past few days, Hindustan Zinc has actually rallied from its earlier fall. Defies my idea, but however, there seems to be some irrationality. The stock fell from a high of 660 to current levels of 606, a fall of approximately 9%.

Tuesday, September 12, 2006

Hindustan Zinc - Time to exit


I think the time has come to book profits on this segment. While there is a big difference in the tracking the actual price of zinc in world and indian markets, the stock however enjoys high co-relation in prices with the London Stock Exchange.

Yesterday Vedanta Resources got hammered in LSE. More on commodities can be found in this:

www.bloomberg.com/apps/news?pid=20601109&sid=aq7F3ZqvOANg&refer=home

I would book my profits and wait for the next move in the market as the stock has jumped from 494 to 664 in less than 50 days. MACD has not given a divergence but the RSI is close to its high at 65. Given that the external environment is not conducive for the company to generate higher share prices in the short term, I would advice moving from this stock and holding in cash.