Tuesday, August 15, 2006

BPCL - A turnaround

BPCL has created a nice chart across a few month. 3 channel formations since mid may. A descending, an ascending and a flat. What is of interest is the recent flat formation of channel. The stock has just broken by an extremely small margin and will be the next candidate to look at for breaking the current resitance and race to its next level of 360-370.

The current conditions in the market is still optimistic for the current rally to extend a bit further. Hence the stock can be held for some time for existing investors and fresh positions can be taken at around 335.

Union Bank of India - Profit Time


Banking Sector has seen some movement in the past three weeks backed by some really strong buying. UBI has been one of the strong movers in this rally moving from 82 to 119 with almost very little correction.

The charts has entered into a nice phase to consolidate its gains. The reasons mentioned as follows
  • The retracements for this stock from its high of 131 on 8th May to its low of 82 on 24th July and back has followed the fibonacci series with little correction at 50% and 38.2% levels. The stock cleared 61.8% with a 9% jump, however, if there is a correction, then 111 will be the first level to be breach to define the next support point.
  • Volumes showed the first divergence (OBV chart)
  • There is a channel range in the long term for this chart at 110 to 120. The stock is currently trading at these levels.
  • RSI has crossed 70 and the stock has corrected at these levels in the previous two instances it has touched these levels. RSI has shown divergence to the current movement of the stock
  • RSI and MACD have shown difference in sign. MACD is still on buy zone with the only indication coming from the column bards
Given all these conditions, this stock is expected to corrected in the short term. However, the first action would be to book profits and look at the next sign of this stock.

Friday, August 11, 2006

Grasim - Upper Channel Resistance


Grasim has turned out to be a good stock to study in the near future.
  • Volumes has started to reduce for every increase, showing indications of the end of the rally for the current period. The stock entered into the channel in June and the rally in the range of less than Rs. 100 throughout the period inside the channel. After being close to the upper resistance channel, the stock seems to have backed, indicating weakness.
  • MACD column charts has started to diverge with the lines, again an indication of weakness
  • RSI, seems to be only saving grace, but it has remained neutral.
Hence the stock to enter into a correction phase.

Bluestar Infotech Limited - Profit Time


Bluestar Infotech broke a nice triangle at 81 and has since then rallied to 91, a good appreciation of approximately 12%. What is next in store for the stock
  • RSI seems to have given the first negative sign for the stock. At about 65, the stock seems to be at the end of its rally.
  • The MACD is yet to give any signal, in terms of the height of the column bars. It still seems to be appreciating.
  • The stock has some resistance at 95 from the previous rally in late May.
Given all this, the stock can be looked as a prime candidate for profit booking.

Ashok Leyland - Profit Booking

Ashok Leyland has appreciated from Rs 30 to its current level of Rs. 37. The stock looks to have done reasonable appreciation in this rally. Hence the first call to start booking profits on this stock.

  • The stock followed a fibonacci retracement of 38.2% from its first low in mid June. The stock is now just about reaching this trendline.
  • MACD is yet to give a divergent signal with the help of the column bars. RSI has some strength in terms of support at this level.
If one like to take risk in the stock, one could probably wait for some more time to decide the next signal from the stock. However, profit booking at this time seems to be the right move.

Alfa Laval - A recovery


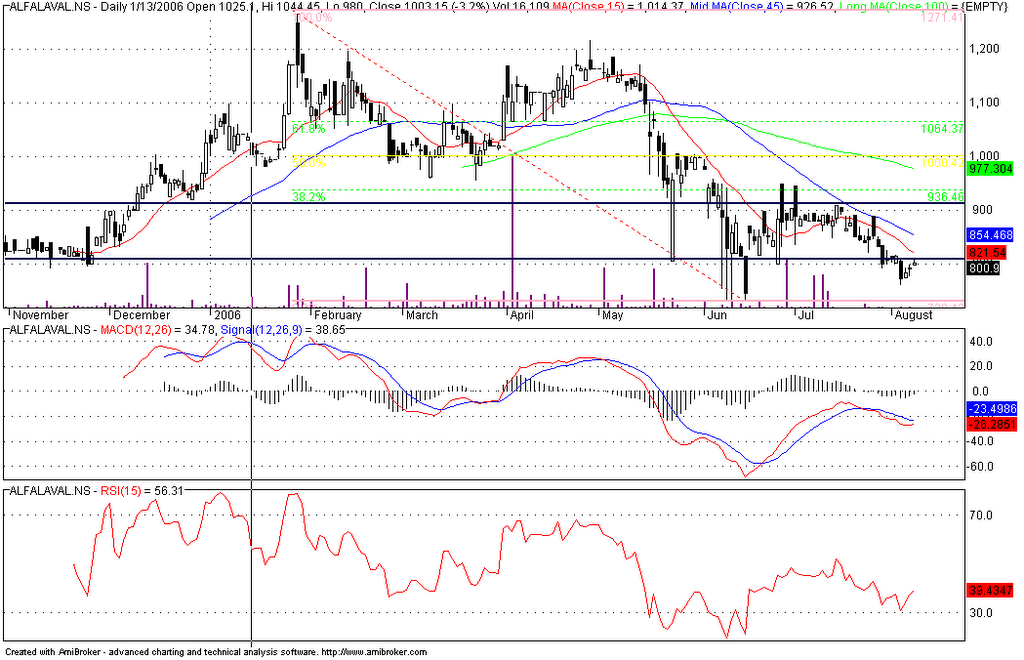
Infrastrcture based companies had taken a beating in the fall of May and most of them have just started to recover. Examples of Rain Calcining, Era Constructions are some, to name a few. One such company that looks like in the path of recovery is Alfa Laval.

The stock took a nice beating in this correction and stock has retraced from its low of 745 on June 24 to its current level of Rs 800. However the following points to be noted
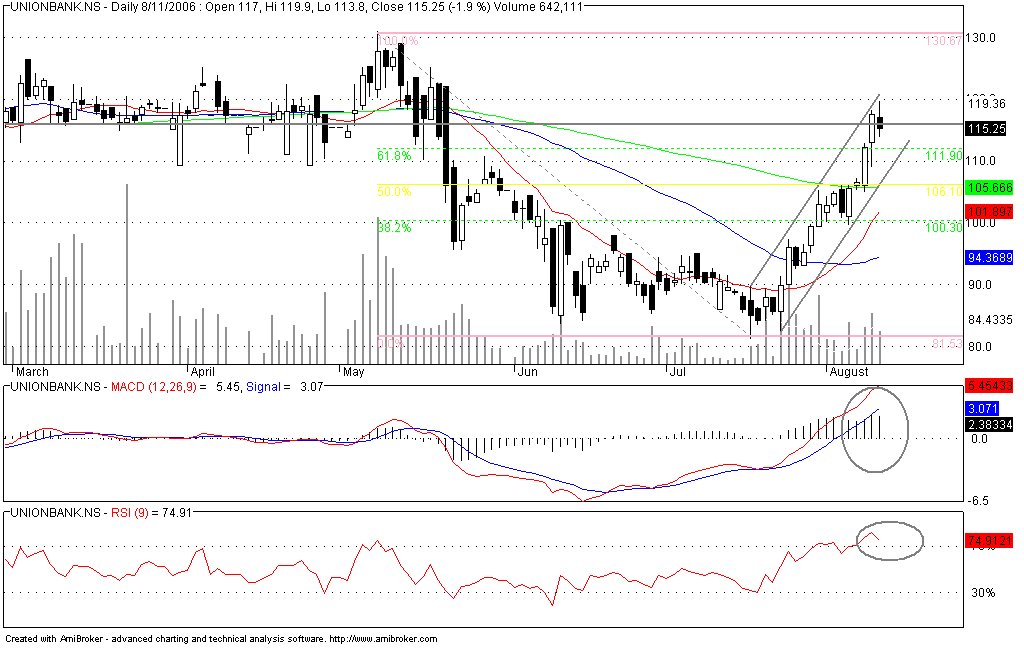
  • The stock has just reached its resistance level of at 8oo and it is time that to note the next movement of this stock. While its support levels seems to be at 745, it looks unlikely that it is in a hurry to fall back, considering the overall movement of interest in infrastructure based companies
  • The MACD chart, esp the columns have started to show an upward movement. This is the first sign that the stock is showing some strength.
  • RSI, has reacted in a similar manner to the price movement. While a lot can be attributed to the recent price rise, the indicator is only at 40, giving some confidence on the movement.
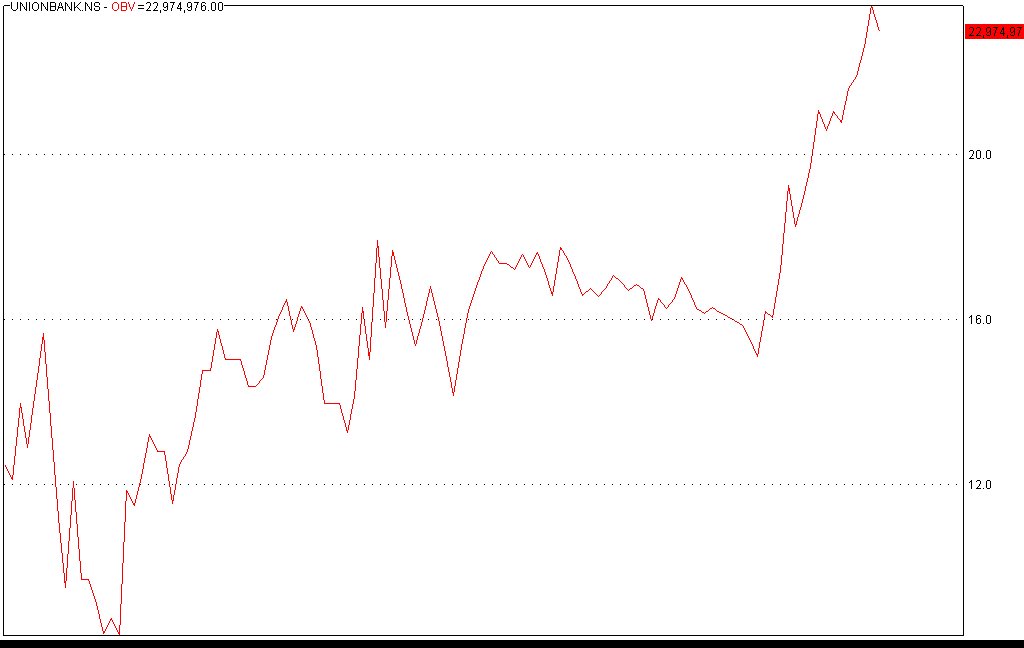
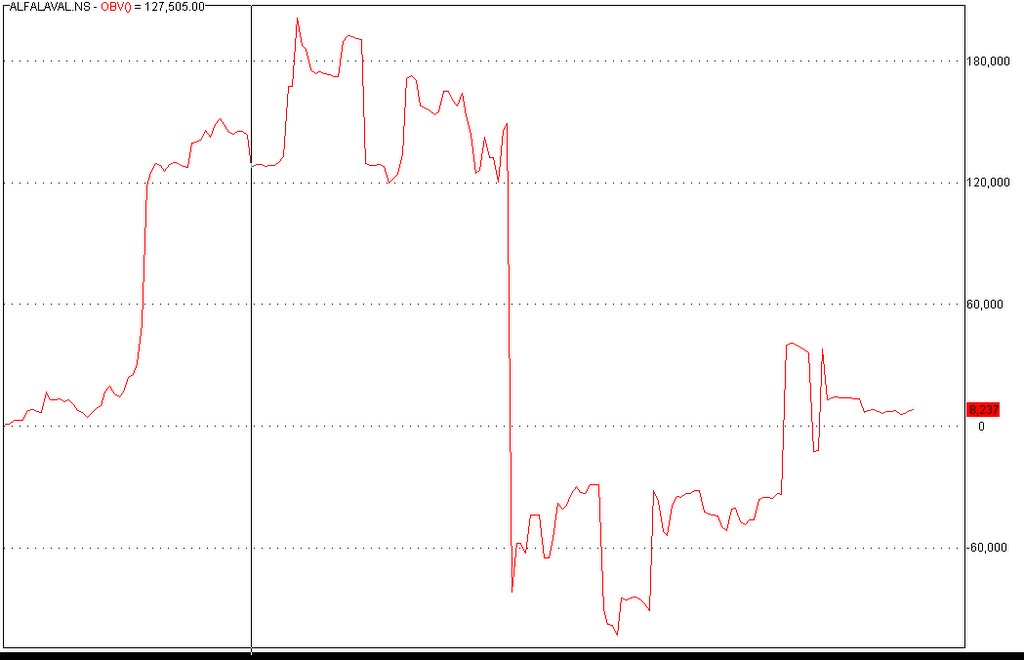
  • The only negative that one can see is in the OBV, the price rise has not seen significant purchases. One needs to be cautious with this sign as there is a possibility of correction only when this is considered in isolation.

However, I like the strength shown in the other indicators and can SLOWLY start building positions in this stock. I like it to be a slow accumulation only for the OBV indicator.
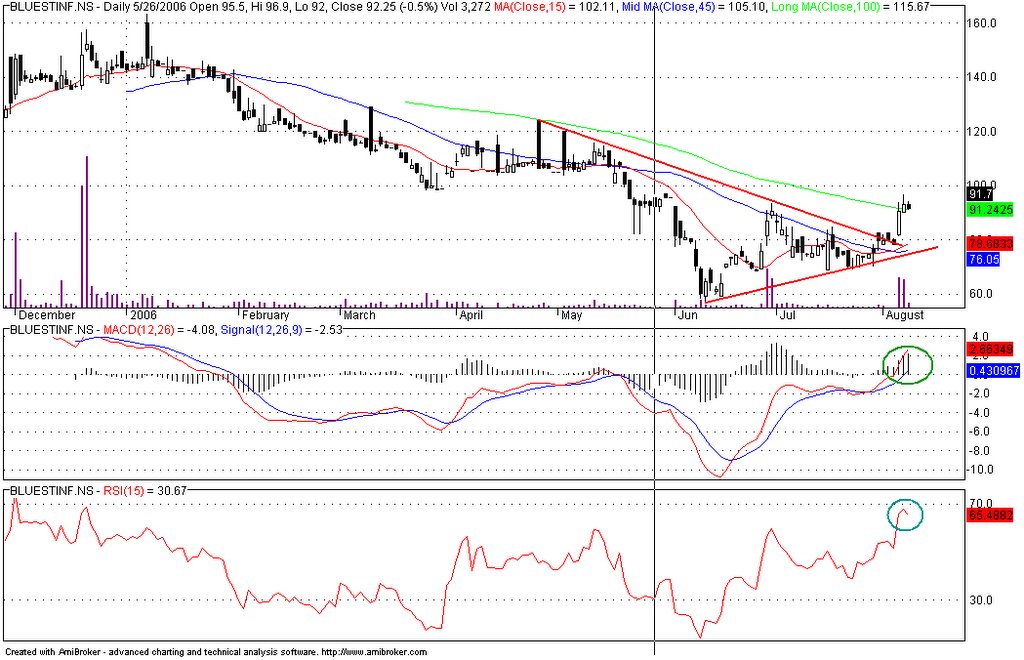
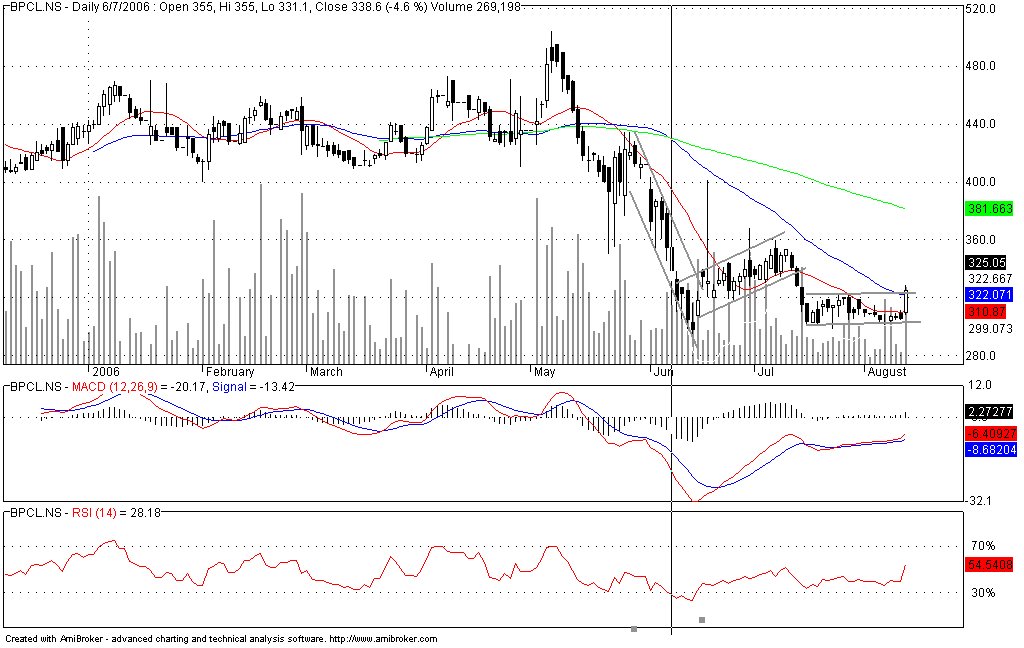