Tata Motors - Stock to Watch
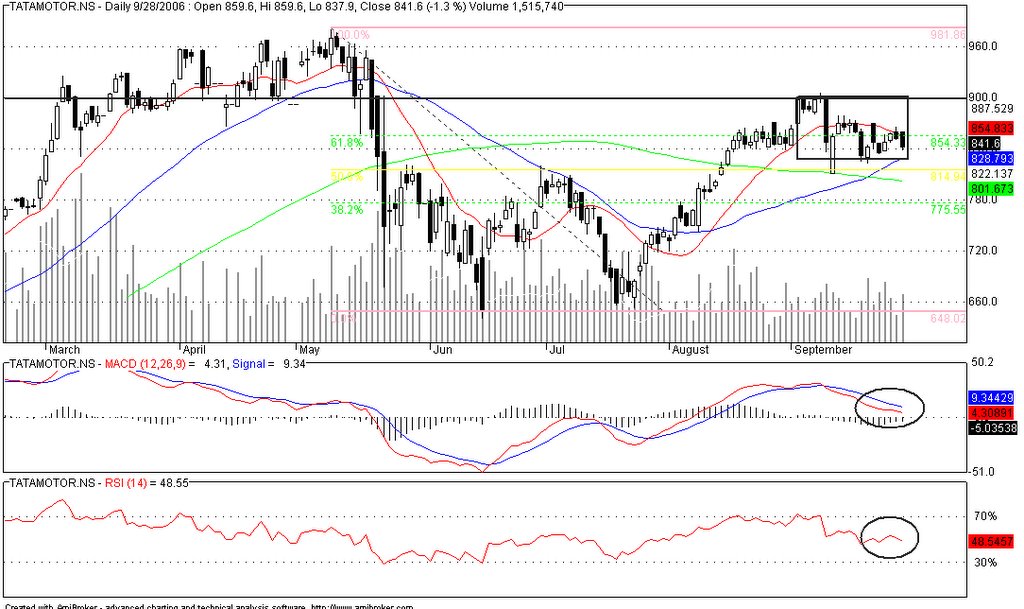
The stock fell hard during the month of May from 980 to about 640. It reacted back before falling back to its previous low in July. Post this, the stock has had a tremendous rally and reacted back to move past its 61.8% levels of its previous fall to 900. The stock has now corrected by just more than 5%.
- MACD charts has shown the decreasing column bars and the gap reducing between the 9 day and 26-12 day chart.
- RSI is still at a comfortable zone, though not in a clear buy zone.
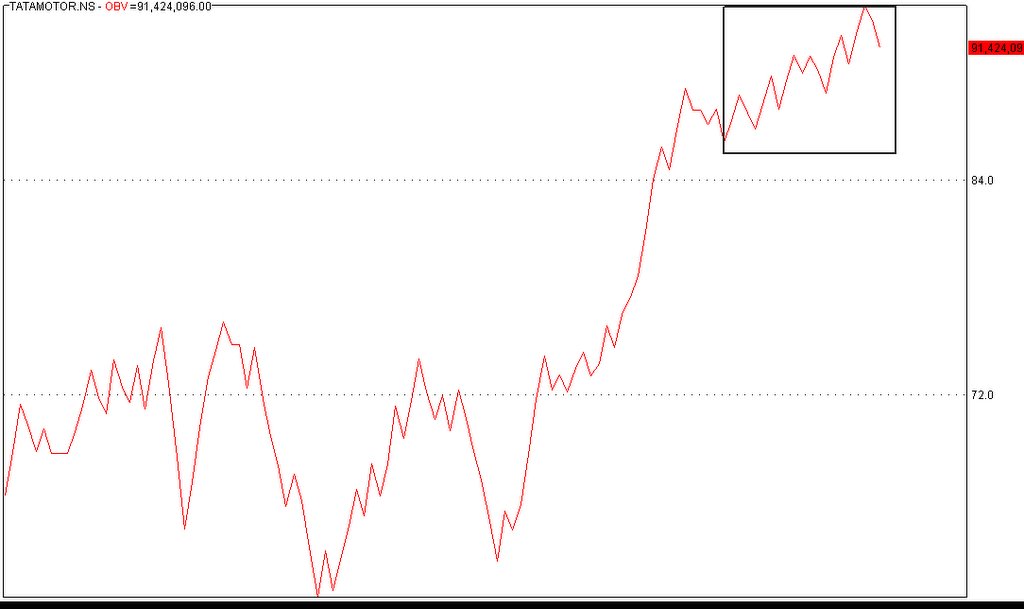
- The interesting formation is in the OBV segment. From the start of the triangle, look at the OBV chart. The price of the share has fallen, however, there is an increasing trend in its accumulation of shares.
Tata Motors Sept vehicle sales up 24 pct
Happy investing
posted by M B Mahesh at 6:20 PM
![]()


0 Comments:
Post a Comment
<< Home