Glenmark - Chart wonder


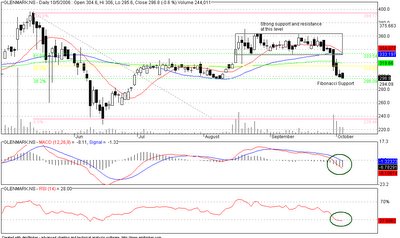
Glenmark is a wonderful chart for any chartist. The stock has broken 333 levels for quite sometime and gave some indication of some serious support levels. Post the news on the company, look at the steep fall. It has broken the 50% quite comfortably and inspite of todays fall, this has not been quite steep.
- MACD is deep in the red but the column bars has remained the same as of last time.
- RSI is super comfort zone
- During the entire fall in this rally, look at the strong OBV line in the next chart. Unlike other companies, where OBV volumes had accompanied the fall, this chart has remained extremely strong. The volumes are still in positive zone. Two important reasons could be that the shareholders are not believing the news and hope to subside or resolved and the other could be that these investors are for the long term of the stock given the growth prospectus. Either way, it looks attractive.

0 Comments:
Post a Comment
<< Home