Gammon - Time to move on


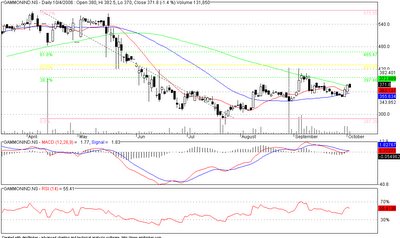
Gammon has been one stock that has been quite unimpressive in this rally. The stock has not convincingly broken 38.2% of its fall from its high of 575 in April to 287 in late July. Some of the other interesting stuff in this chart.
- MACD is showing some indicator. The two lines have broken with one another.
- RSI in comfortable zone with no indication from them. However, there is some divergence with the MACD chart.
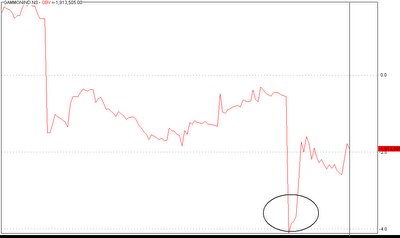
- The other positive signal in the chart is the OBV section. The stock has seen some heavy selling. It is still in negative zone, indicating that a rise in price can be a sustained one, if it occurs in the near future.

0 Comments:
Post a Comment
<< Home