Thursday, November 30, 2006

GAIL - Upper Channel


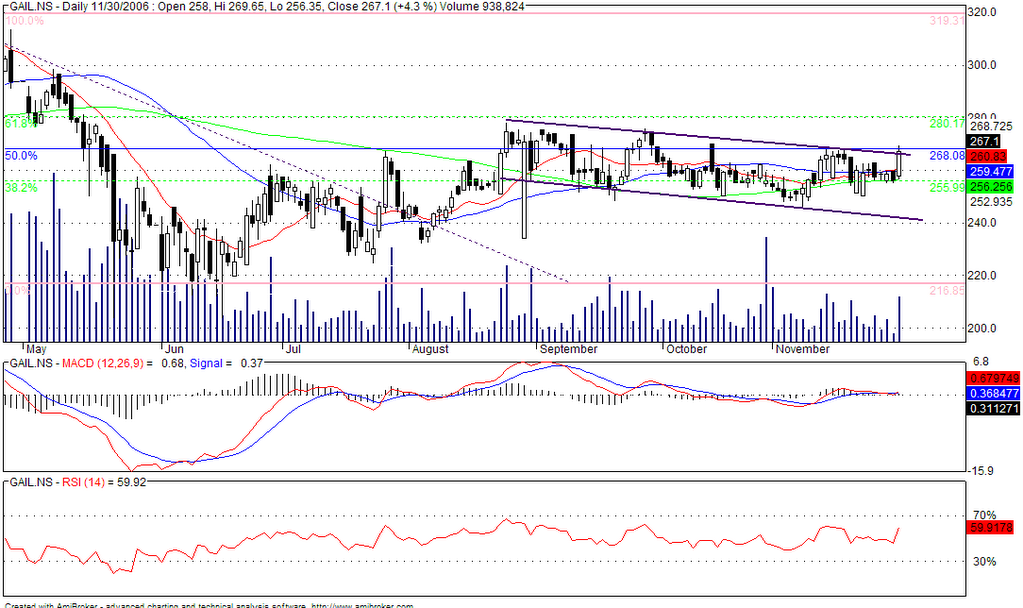
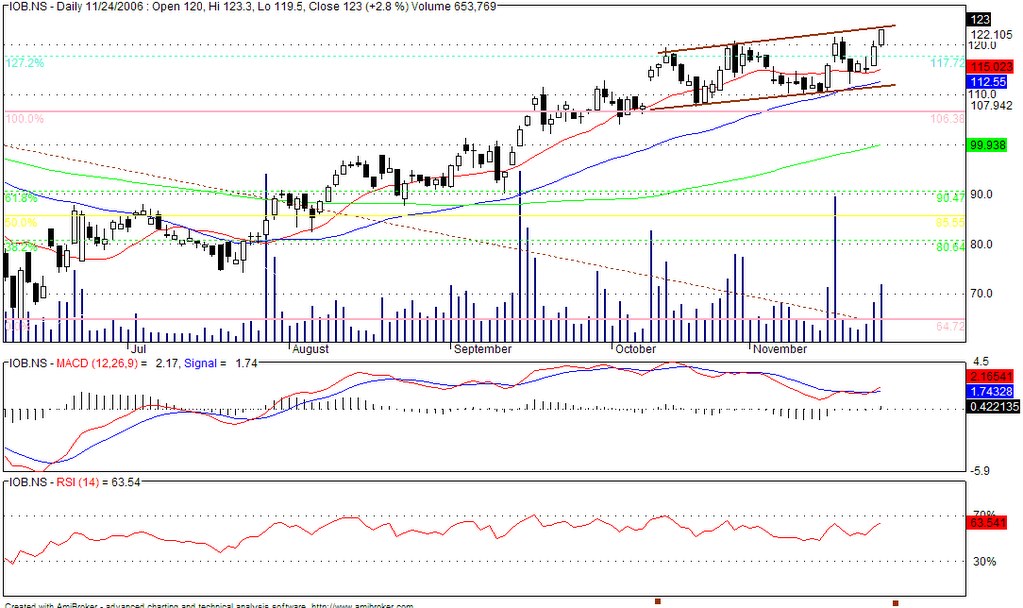
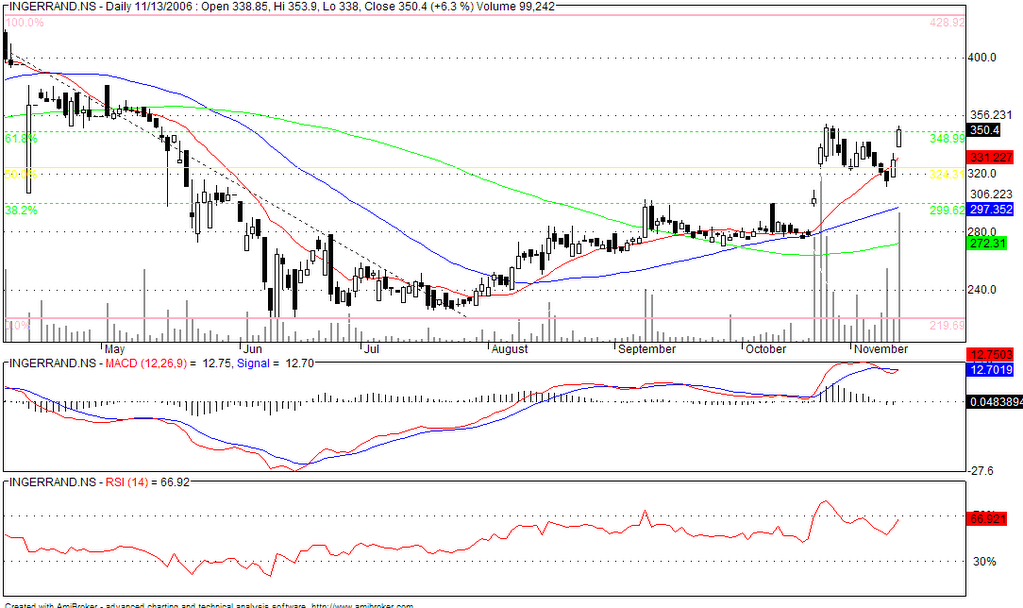
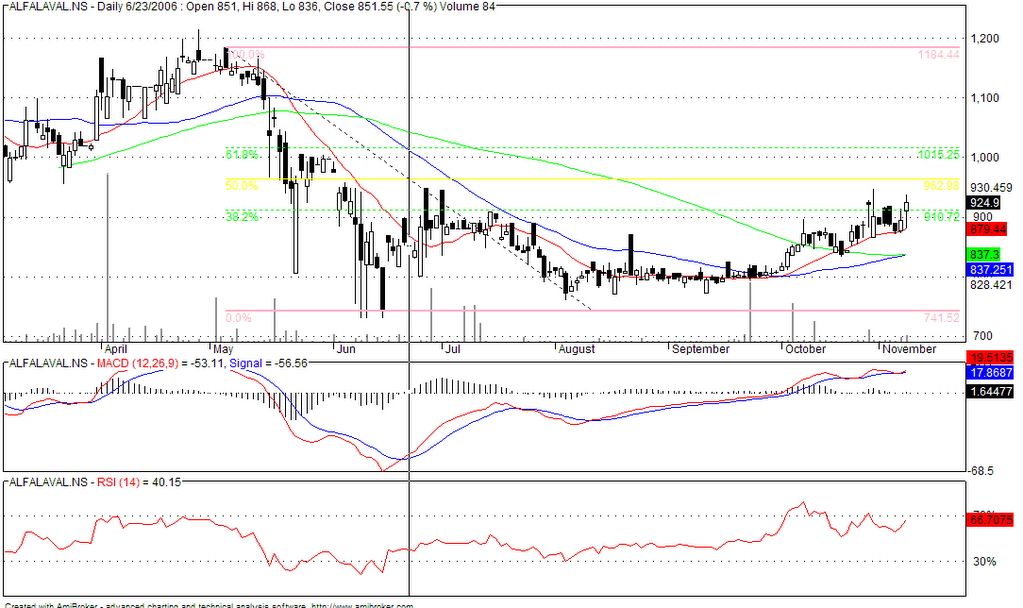
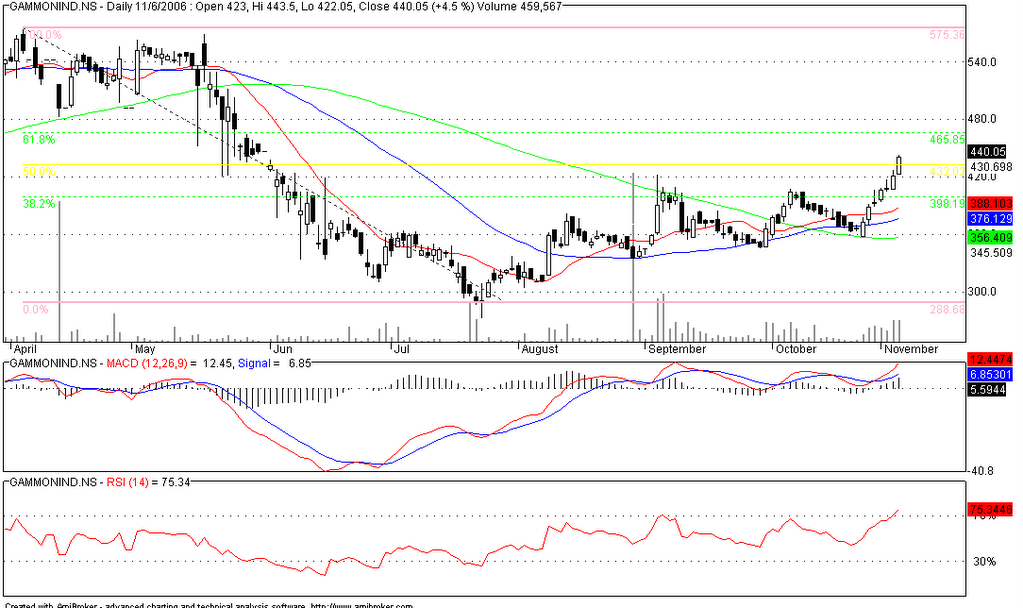
GAIL has reached the upper channel. The stock has been languishing at these levels for more than 3 months now. The stock has not on comparitive terms done on fairly higher volumes when compared to the previous few trading sessions. The stock is yet to provide any signal from any of the charts. However, the following needs to be noted
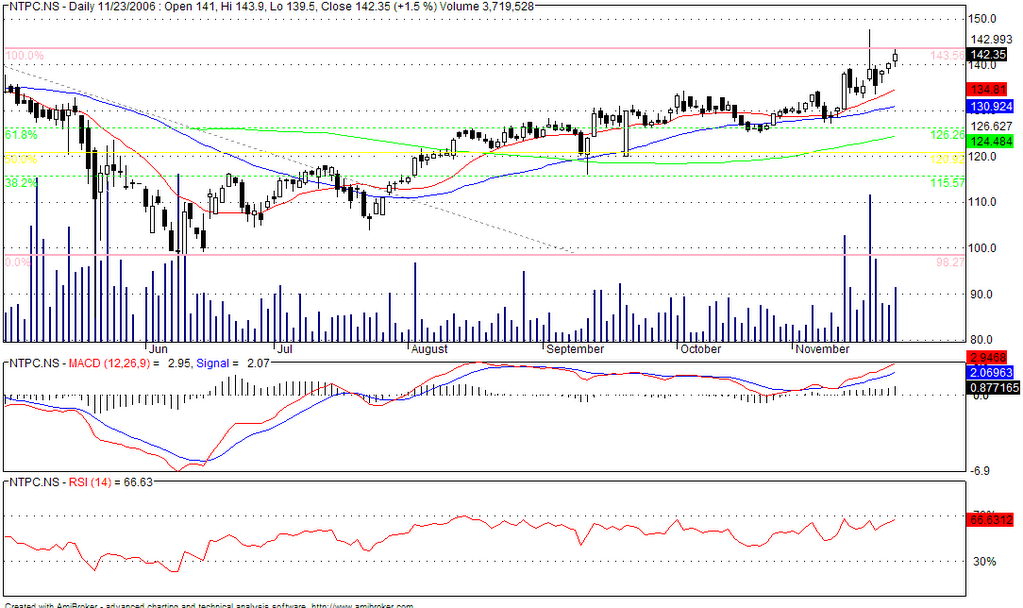
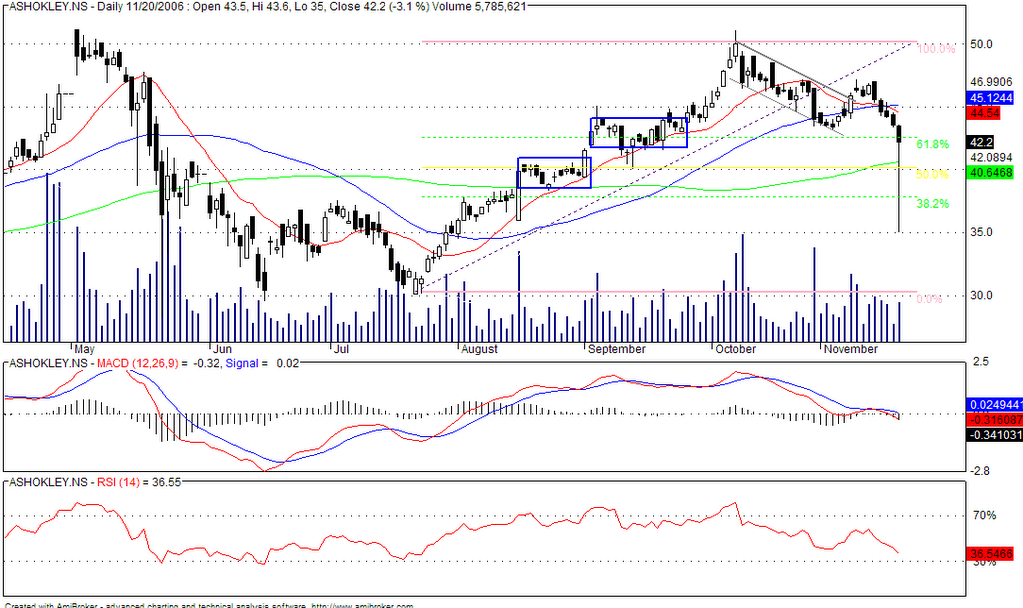
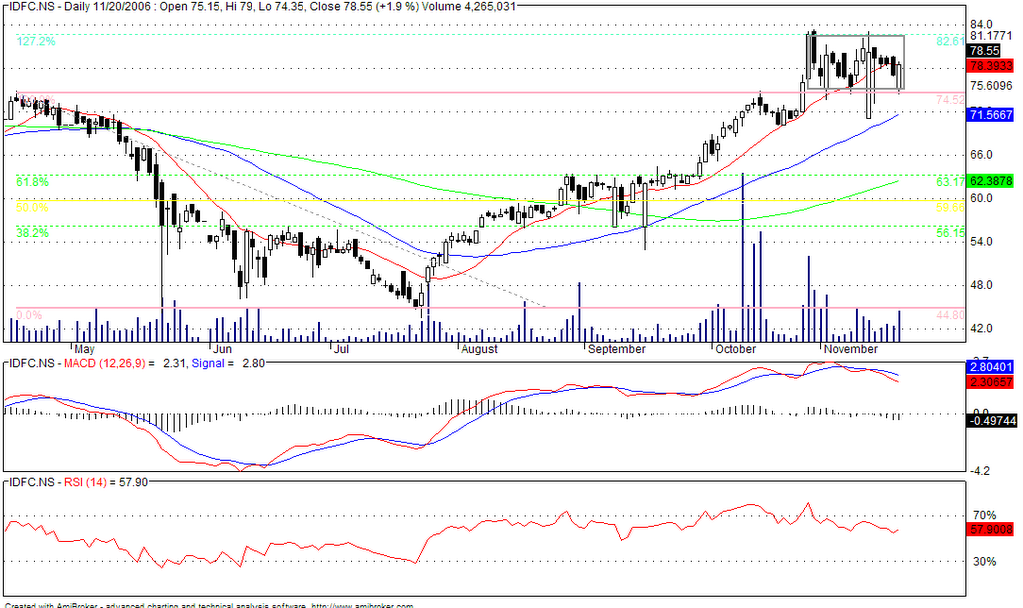
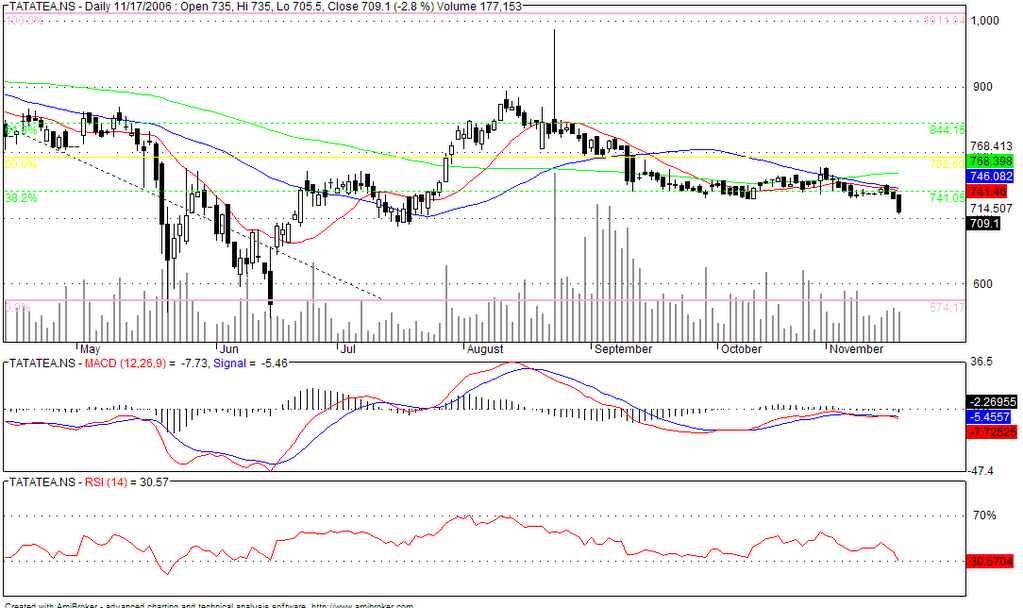
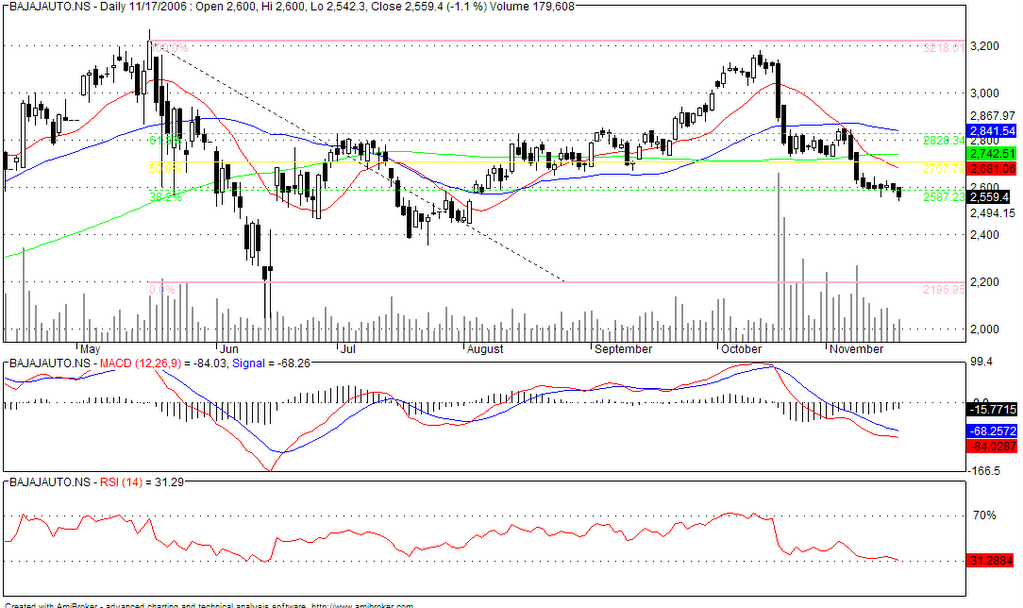
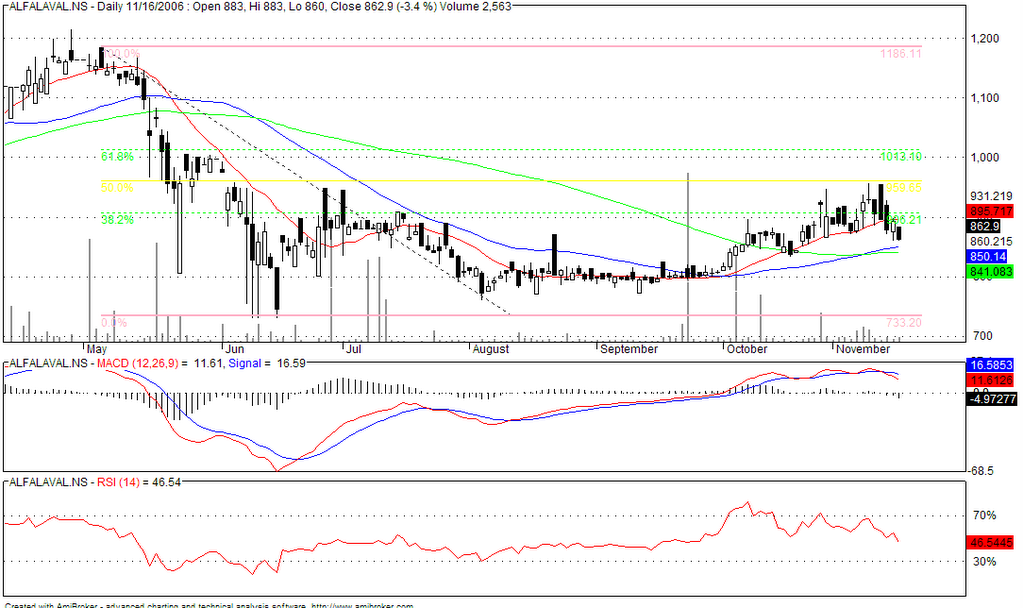
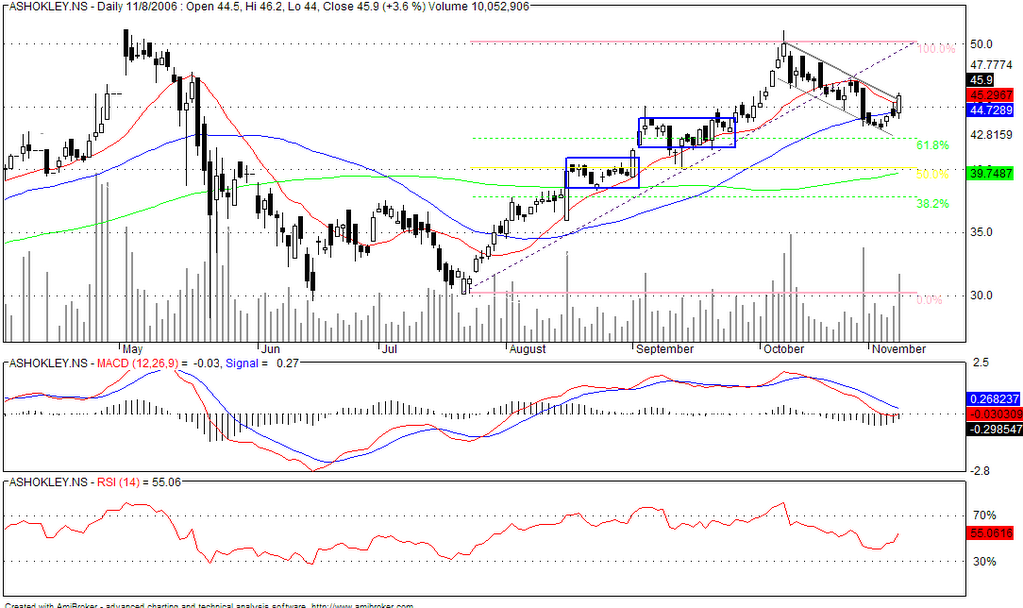
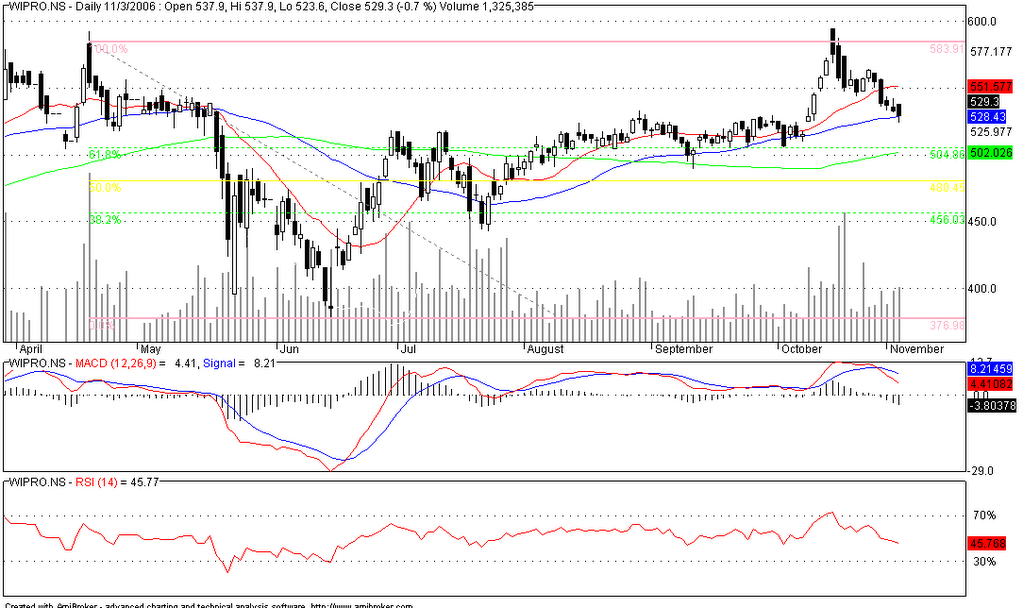
  • The price is moving on a channel. The stock has now reached its upper level of the channel and there is a nice opportunity of the stock looking at either side of the channel. However, history of this stock if one takes the past 3 months as a base, this does not look like a good possible.
  • MACD is still not on the strong side to provide with a 'buy' signal
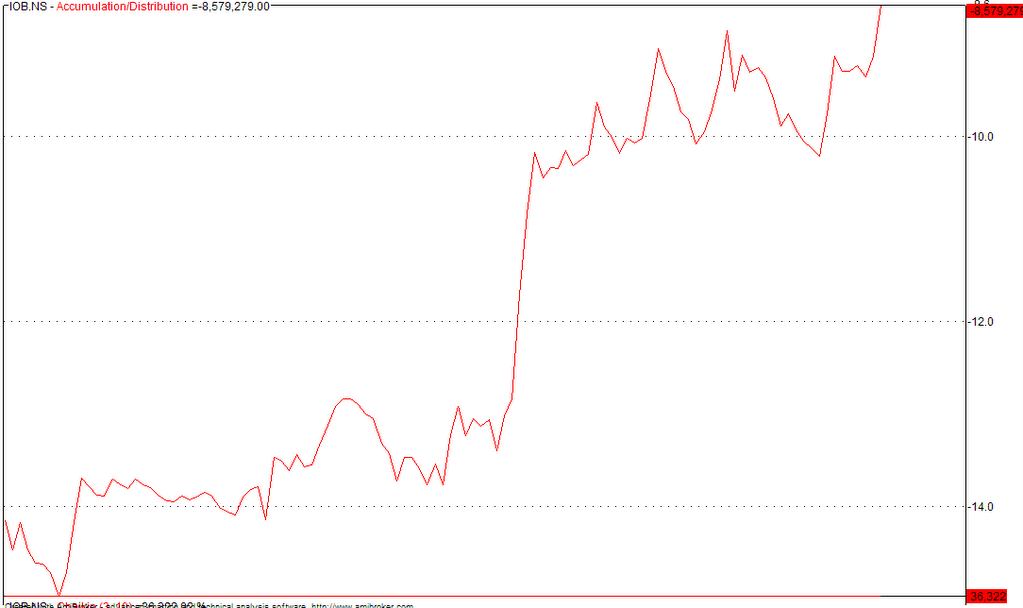
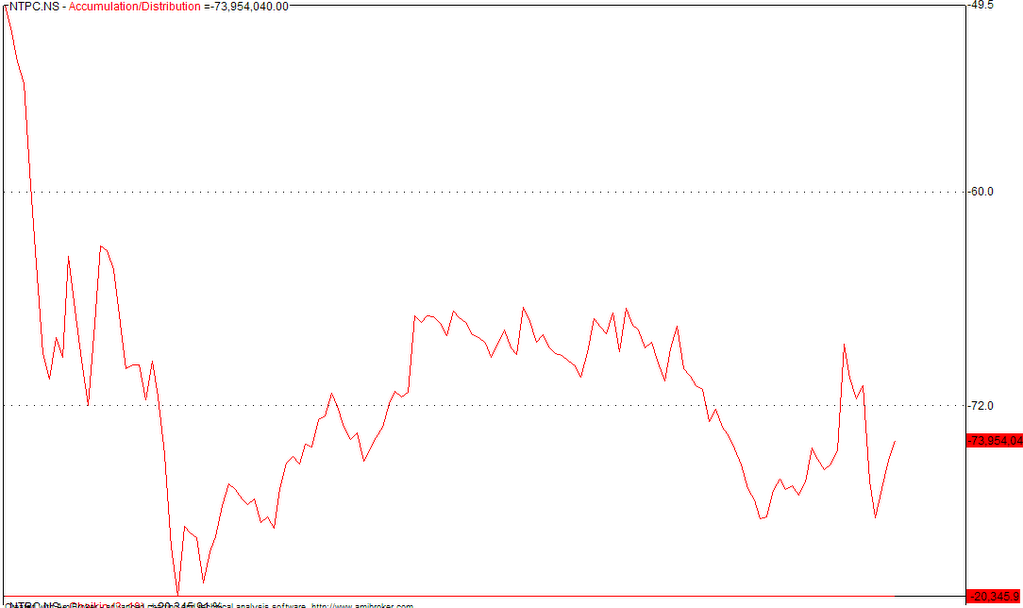
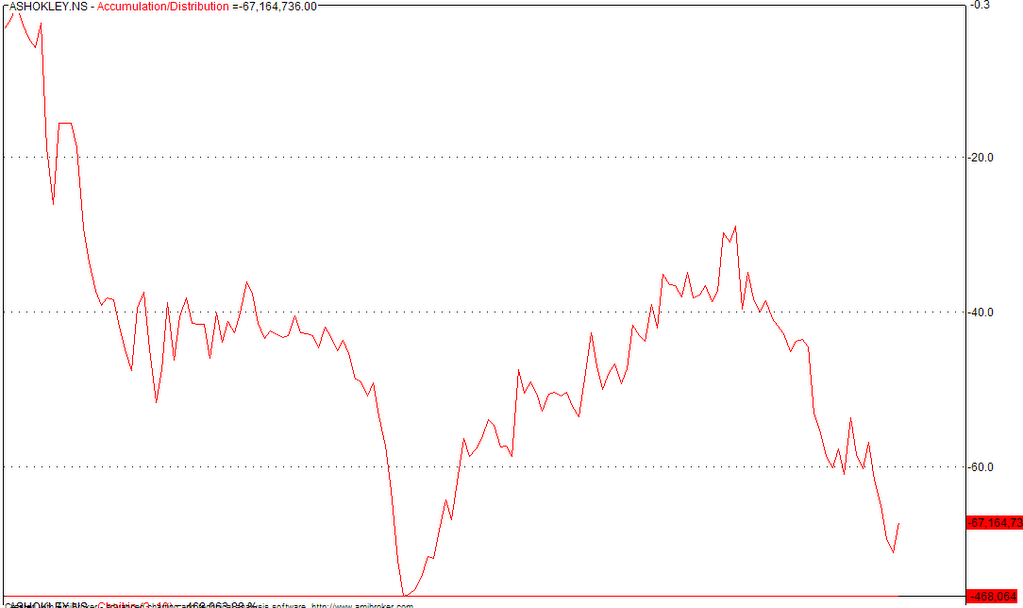
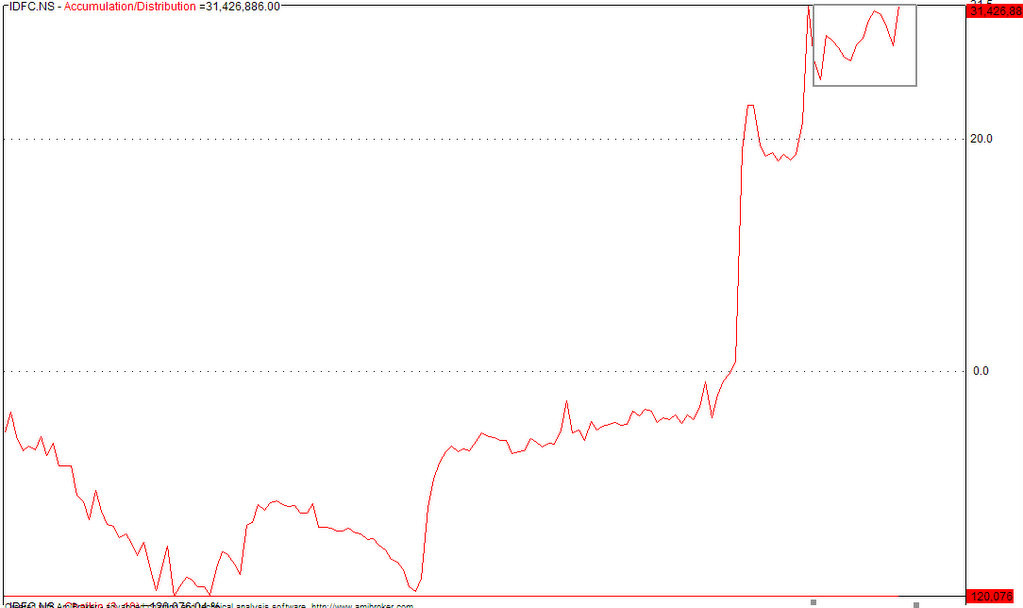
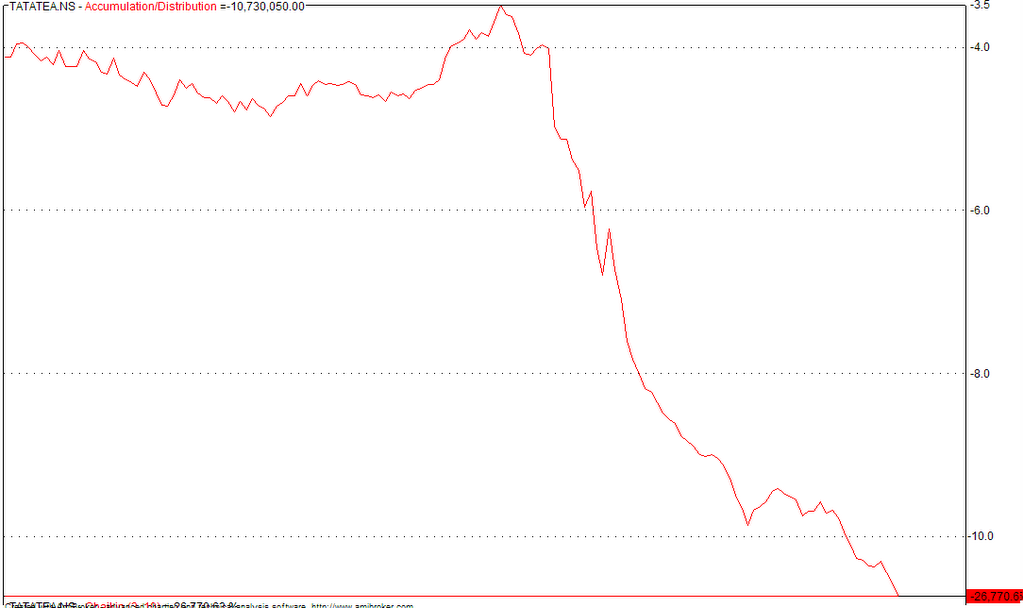
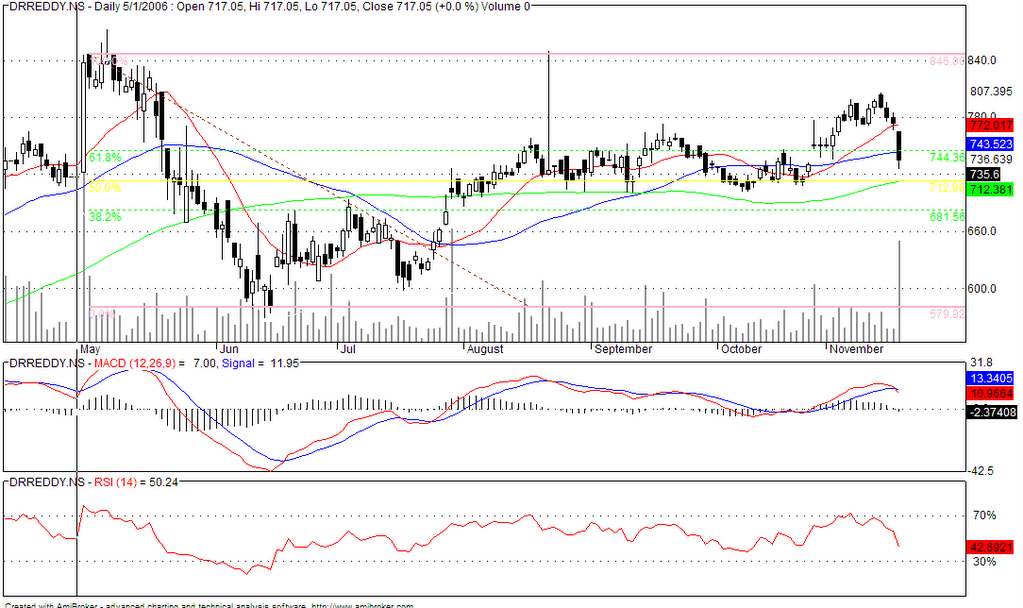
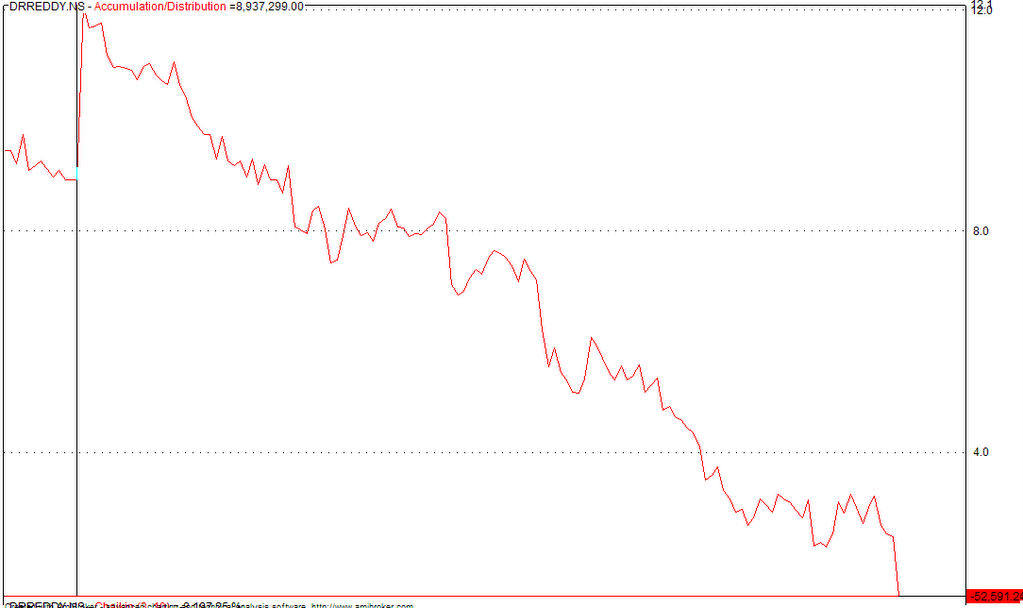
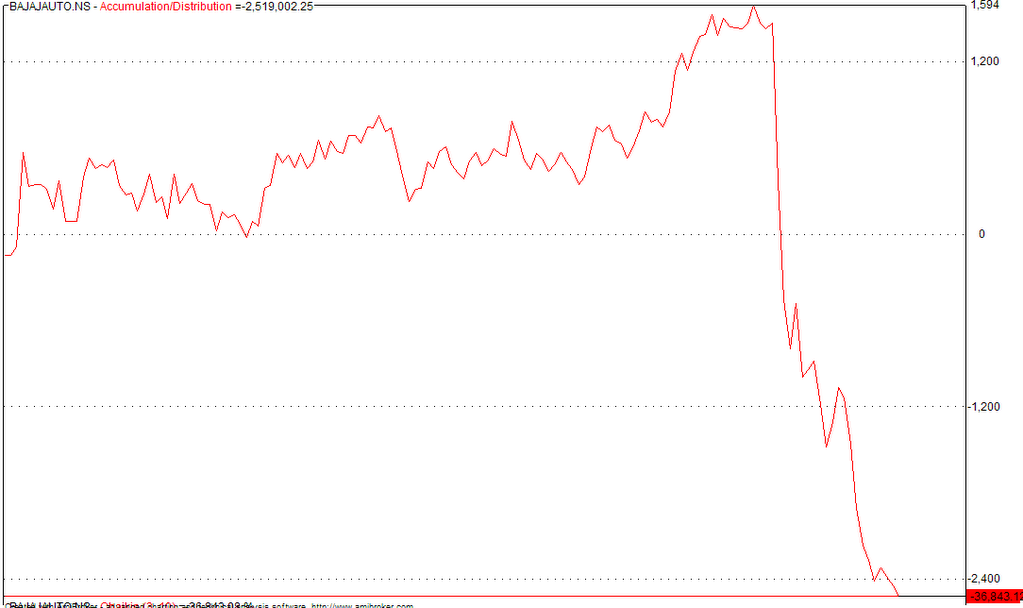
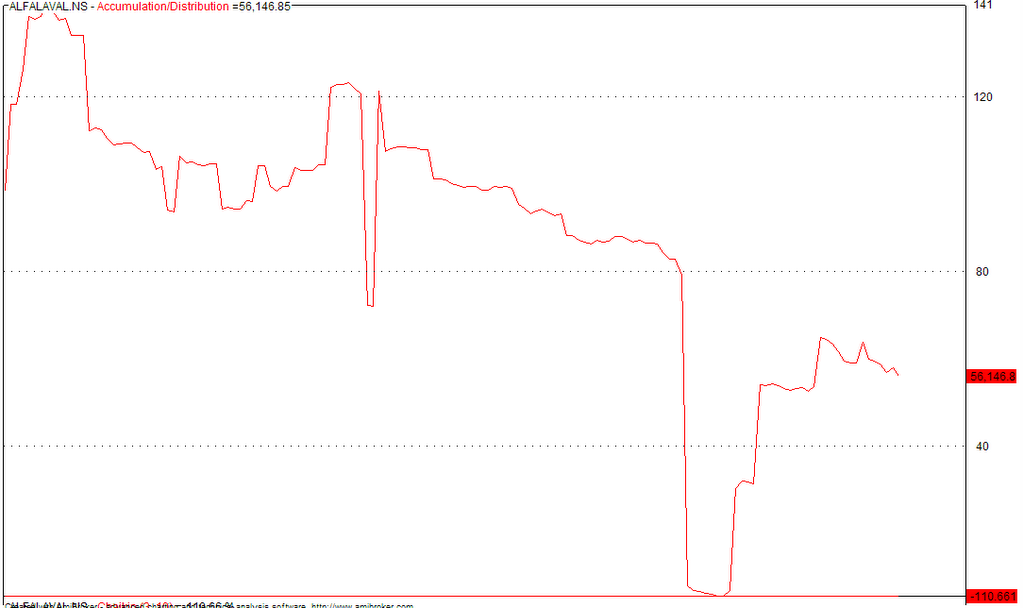
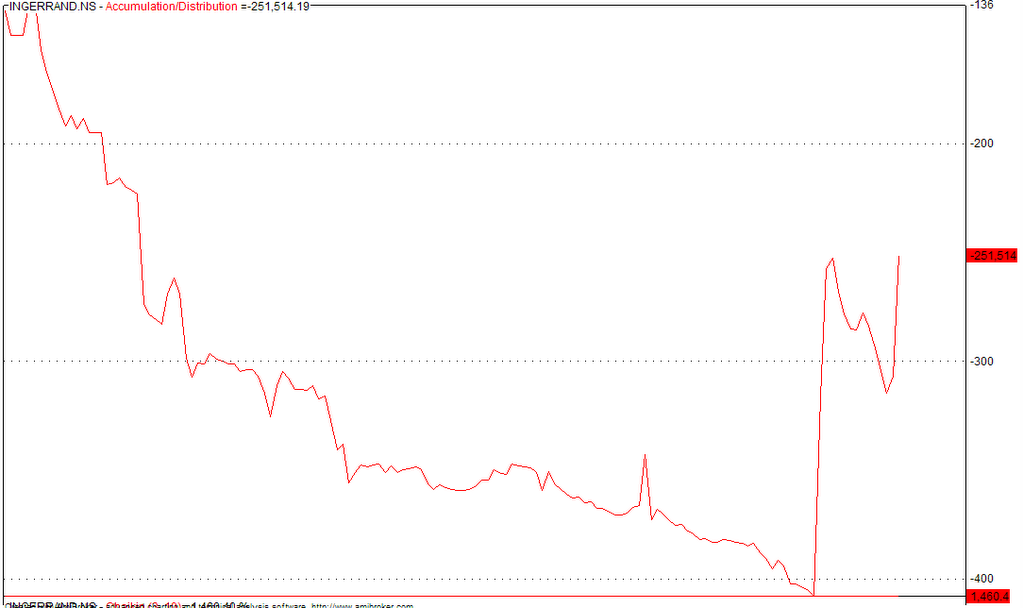
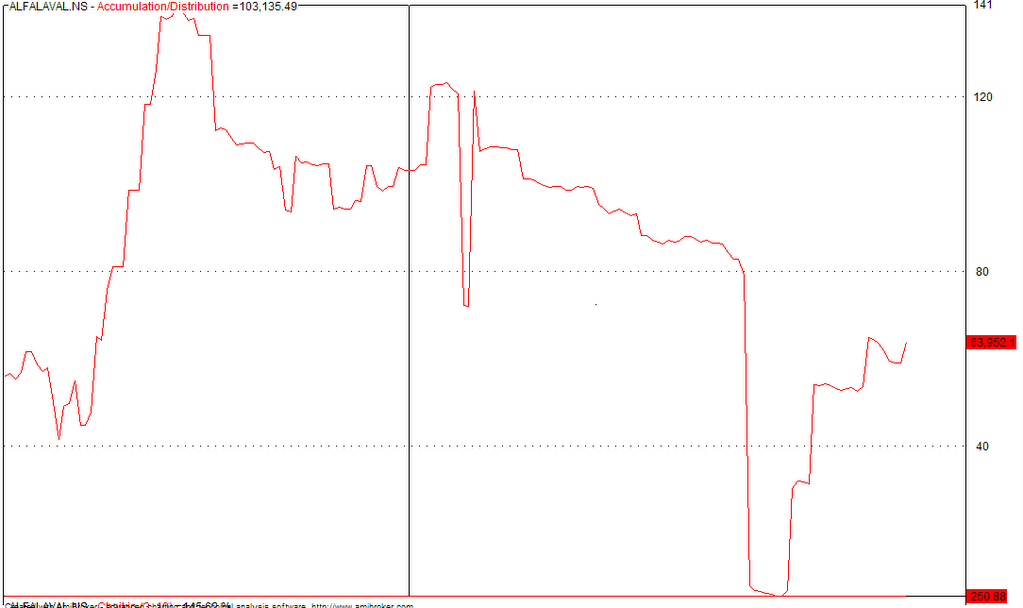
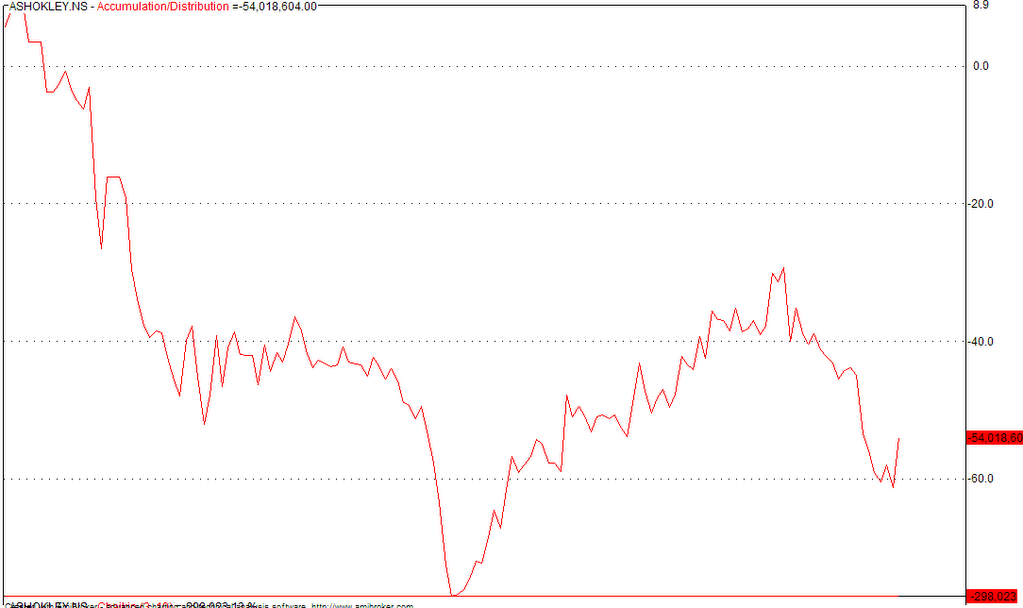
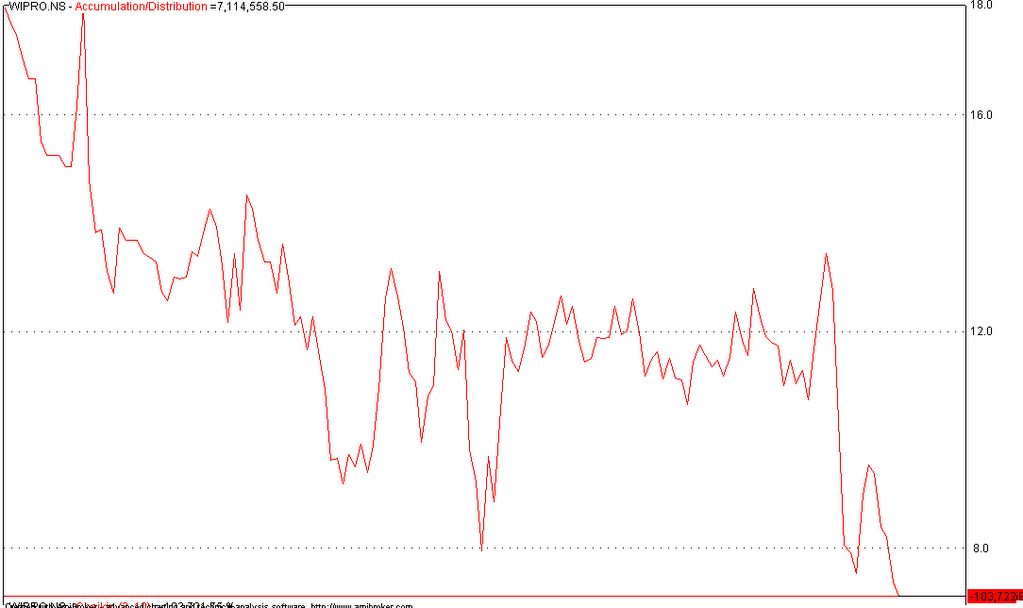
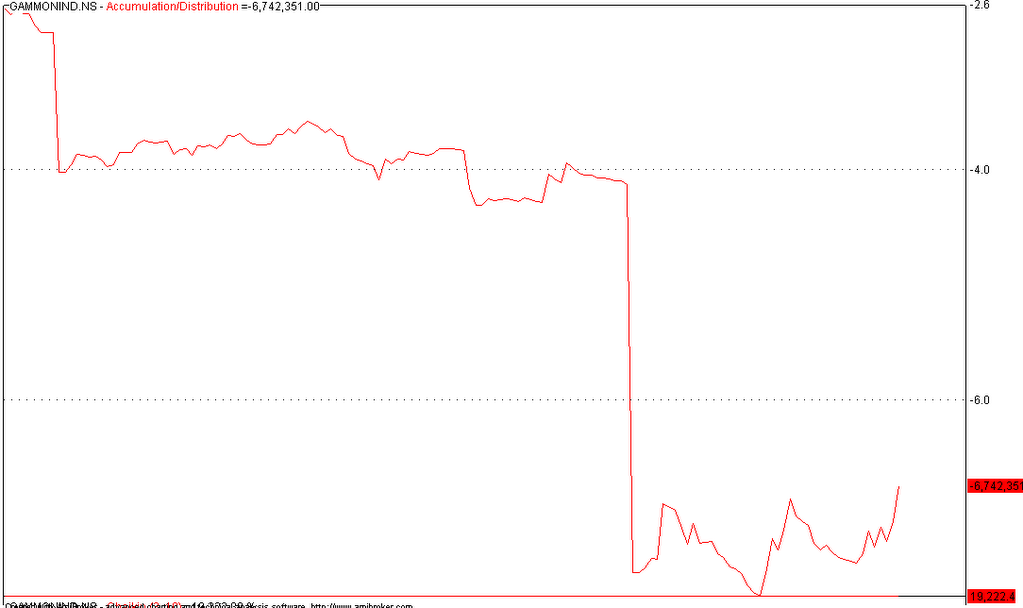
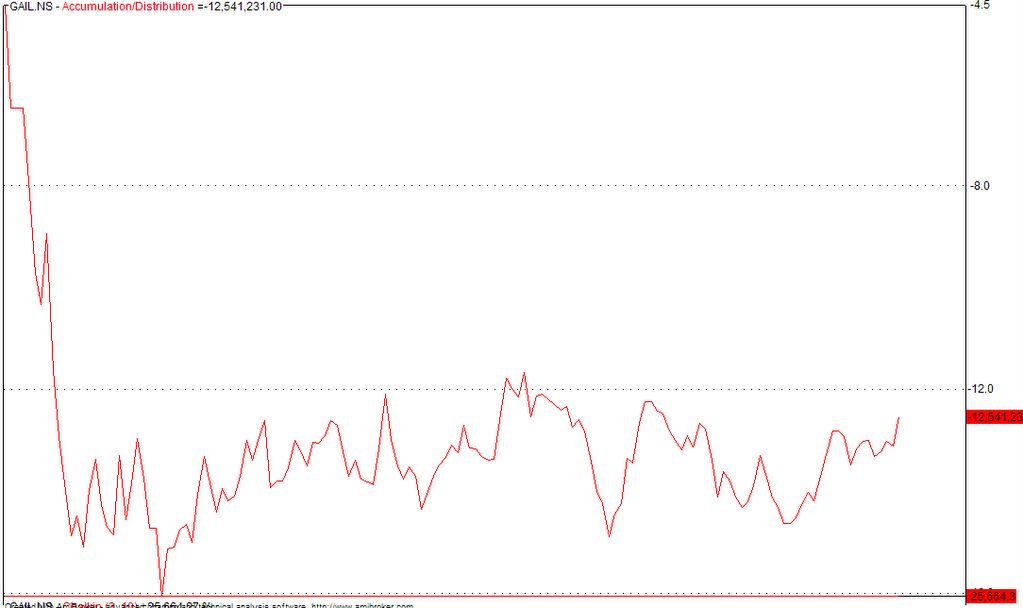
  • The Accumulation Distribution chart is probably an interesting one to look at. Unlike a Dr. Reddys where we have seen heavy selling in the stock. This stock has not done anything of that sort. There is neither strong accumulation on downsides or heavy selling on upsides. This provides some sanity of the strength of the stock at these levels.
If the stock has to break on the downside, it could see 255 on the immediate level, and the next would be somewhere at Rs. 240. Upside really is not that bright either. One could look at a possible upside at Rs. 280. However, at current levels this works to less than 5%. If one is happy with the downside risk of the stock and is willing to take a chance for the upside, then one could buy the stock.

Friday, November 24, 2006

IOB - Stock to watch


IOB is at a nice level for some action on either side.
  • It has broken 127% line at 117.2 on strong volumes, as reflected from the Accumulation Distribution Chart
  • It is at the top of a channel formation. So the chance of a breakaway or a correction on the stock is imminent.
  • MACD signal has just been broken giving a 'buy' signal on the stock while RSI is relatively expensive
It will be a good stock to watch the run incase the stock breaks the channel formation as it will give a buy signal for the stock. However, if the stock retracts from this level, expect the stock to retract to Rs. 112 and if it still not comfortable at that level, this stock can fall to Rs. 106 from the fibonacci charts.

Thursday, November 23, 2006

Reliance Energy - Finally some power!!


Reliance Energy is probably one of the few stocks that completely missed the recent rally and wanted some information to actually trigger the price rise. Its recent news on having received an order that exceeds 2000 crores, probably is a good start. With more news on the mega projects coming up in december, this stock looks like an ideal candidate for a start of a decent upmove. However, on the technical side, the following would be my thought:
  • The MACD is still above the technical signal line. Also, the volume bars are just increasing. Hence, the stock is on a decent plane though not very bullish at this point.
  • The accumulation distribution chart for the chart is probably more volatile than the stock itself. It surprised me totally to see a stock that is so volatile on the volumes. The stock seems to be a traders paradise, as the stock cant be so volatile given the small movement on the prices.
For now, the stock needs to break Rs. 552 convincingly. If the stock break Rs. 570 then, I would wait for the stock to still move upwards. I would have a target of Rs. 600, which is 78% levels for the stock. On the down side, if the stock falls below, Rs. 535 -then the stock could see some pressure to fall back to Rs.520. Hence, this gives the upper and lower target for the stock.

NTPC - Target Reached


NTPC has reached its 100% retracement today. The stock touched a high of Rs. 143 and the volumes at which it has reached this target is something that is comfortable to see.
  • MACD is still in a bullish zone and given the recent rally in this stock, RSI is expected to be on an overbought region
  • The accumulation distribution chart is still showing some strength in the recent movement.
Hence, I would partially book profits on this stock and look at exiting this stock if it breaks 138-140 on higher volumes. Fresh exposure on this stock can be taken only if it breaks Rs. 148 and if there is strong volumes in this movement.

Gammon - Second Target Reached


Gammon has reached its 50% Fibonacci series. The stock closed at Rs.431, bang on at 50% level. At the current position, the technicals are still favouring the sellers than the buyers.
  • MACD has just turned to a 'SELL' with the line breaking the signal line.
  • The volume chart on Accumulation Distribution chart shows that selling is still largely there on the stock.
The targets for the stock would be at Rs.397, if it still falls further. However, for investors currently in the stock, do not sell till it breaks Rs. 418-420 as the last few days, the volumes are actually receding by the day. For potential investors, the stock is at a range where there is a resistance at Rs. 460. But to take a comfortable position, any exposure after Rs.452 would be an ideal one. But given the upper resistance at Rs. 460, this makes the investment an unviable one. Hence, lets wait till it breaks Rs. 470 to take any position on the stock.

Monday, November 20, 2006

Ashok Leyland - Support Level Reached


Ashok Leyland has reached its support level. The stock could not maintain its recent rally for long. The stock has retraced to 61.8% of its recent high of Rs. 50.
  • MACD which was close to giving a 'buy' call has since been on the negative side.
  • RSI is on a comfortable zone that can lead to a oversold condition of the stock, something that I shall not expect for now.
  • Accumulation Distribution chart is still largely unclear. The small spike could be of little significance unless this range is broken and convincingly.
The stock has now entered a range that it found difficult to get past last time. What is important to note would be the pace at which it is moving in this segment. If the pace is moderate, then it would be a wait and watch. If the pace is faster and on the downside, then the stock would fall to Rs. 40 where it has the next set of support points. On the upside the stock could get back to Rs. 45.

IDFC - Rangebound


IDFC is still moving with some range bound movement. What still remains is the direction of the next set series. The stock had a strong rally since mid-September. Having completely retraced to its previous high in April, the stock rallied further to 127% before entering into a range between 100% and 127%.
  • MACD is showing increase in the size of the column bars. Not a good indicator for an investor of the stock.
  • RSI is still in a zone of 'sell'
  • Accumulation Distribution is where there seem to some divergence to the current signals. In spite of the recent fall, the volume is increasing in this stock, in spite of the recent correction in the stock
Overall, though there is some inaction in the stock, the following would be the range one needs to look at : If it breaks 82.61 the stock does not have a history to back upon. However, the next target could be at Rs. 100 (167% at Fibonacci charts, in case one is wondering where the number came from thin air). However, with the current conditions, I would not bank on this target for the upside. I would book profits at 82 and wait till it breaks 85 on higher volumes. On the downside, the stock could see some correction at Rs.70 and then at about Rs. 63. Given this range, I would like to have no fresh exposure in this stock and wait for an opportunity to book my profits.

Tata Tea - Negative Breakout


Tata Tea finally could not hold any longer. It has tried holding its support line for more than a month now but finally it broke : "But broke the support line" . 740-730 was a crucial price for the stock to maintain. However with the current price at Rs. 709, the stock looks to have broken the support.
  • MACD is still unclear for the signal to give on the stock but looks like the signal would be clear in the next few days.
  • RSI though is on the oversold side. This could worsen further, if the stocks still has some pace in the downfall.
  • Accumulation Distribution chart is similar to Dr. Reddys, mentioned yesterday. Moving down across time.
In terms of the next support, the stock will have to break Rs. 690-680. Stock will need solid buying on the upside if it has to reach its current upper target of Rs. 730 as the first target. Though, the stock looks exciting to 'buy' given the upper and downside targets, I would like to wait a few more days as the current underlying Nifty is showing some volatility that is like a correction.

Sunday, November 19, 2006

Dr. Reddys - Diverging Trends


Dr. Reddys chart is probably one of the better stocks to look at to understand why volumes are needed for a sustainable rally. The stock has fell by over 35% since May and the stock has rallied by more than 30% since that fall. However, the most interesting is not in this chart but in the Accumulation Distribution chart. The stock has not been able to replicate the return on the volume chart. It has largely been falling in this market in spite two big changes in the price movements. Largely investors are existing out of this stock.

  • MACD has given a 'sell' on the charts.
  • RSI is falling drastically and is not a good sign at the pace of the fall in the technical side
Yet another interesting fact is that the stock has just broken the 61.8% support line. It still remains to be seen if it would touch Rs. 712 where the stock has some support level at 50% Fibonacci series. However, the following needs to be looked at before entering into this transaction. The stock has not convincingly broken the support level. Unless the stock falls to Rs. 730, where there is a strong possibility that Rs. 720 could be touched just about immediately considering the volatility of the stock.

On the upside, unless there is volume, the rally just cant sustain. Hence, this is a stock with immense potential but a wonderfullandmine in the stock.

Bajaj Auto - Negative Breakout


Bajaj Auto has just broken one more trend line at 2587. Not a good sign considering the movement of the index.
  • MACD is still in negative zone but the column bars are reducing, showing some possible sign of a reversal of fortune
  • RSI is in a near buy zone for this stock. However, largely this is the effect of the recent continuous downtrend in the stock price.
  • There has been some really heavy selling in this stock. The stocks volume has just increased over a period of time. This can be seen in the Accumulation Distribution chart.
What is need to looked at will be the support level that the stock has seen over the past few days being broken convincingly. If it is not supported with strong volumes from here, there could be a possible reversal in the stock. The stock from here, if the current support level is broken can fall to 2400. Now that is a possible 8% downside on the stock from current prices. However, on the upside this is limited only to 4%. Hence, given the higher probability of a downside, I would wait and definitely watch the movement in the stock.

Friday, November 17, 2006

Arvind Mills - Break Neck Speed!!


Arvind Mills is gaining steam on the downside at some really break neck speed. While I dont seem to have any sound information for the downside, what is really surprising is the speed of this movement.
  • MACD on a 'sell' but the volumes at which it is falling has slowed down a little creating a small up movement in the bars of the MACD chart.
  • RSI is on a 'buy' as it is largely in an oversold market.
  • Accumulation Distribution chart has given no change to indicate of a possible reversal.
Given the above conditions, the silver lining for people who are holding this stock would be that the stock is reaching its fibonacci support levels, which is on a historic basis. A possible greater downside would be if it breaks 52. If there is a reversal at this level, fresh bargain hunting can be made.

Alfa Laval - Stock Correction


Alfa Laval has seen some correction in its prices, since it reached its second target. Some notes in this correction
  • Volumes from the Accumulation Distribution chart indicate that the stock has corrected on very small volume movement.
  • MACD has turned to a 'sell' signal and RSI has seen some rapid downside.
Targets for the stock would be currently at Rs. 800 on the downside. A reaction for the stock can take it back to Rs. 905. For the meantime, this is a wait and watch the downside, if it exists.

Wednesday, November 15, 2006

Tata Motors - Bounces Back


Tata Motors has just started to look positive on the charts. Having tested the key 50% decline line, the stock has since bounced back 3% to give some cheer to the shareholders.
  • Volumes are not one would call encouraging. A possible reason for the same could be that the rise has just started and investors are having a wait and watch on the stock
  • MACD is yet to give a 'buy' signal on the stock, and RSI is trading at a very cheap level, indicating some level of value buying availability on the stock
  • The stock has a critical resistance level again at 67% coming in the next few days.
Overall, would wait for the stock to break Rs. 850 and also probably 865-870 levels to enter into this stock. Currently, this stock has not had strong volumes, as indicated in the Accumulation Distribution chart. So wait and watch would be the call.

Monday, November 13, 2006

Ingersoll Rand - SecondTarget Reached


Ingersoll Rand has reached its second target in this rally and it looks like the infrastructure based companies are getting some attention. It broke the Rs. 350 barrier today convincingly on strong volumes. What is to be watched is the next movement in this stock.

  • MACD has just broken and given a 'buy' signal with the bullish line breaking the signal.
  • RSI at 66 is getting expensive - a caution to be considered because of the rapid run-up in prices
  • As mentioned previously, the volumes is encouraging. The accumulation distribution chart has given some strength to this movement
Targets for this stock would be Rs. 388 in an uptrend and Rs. 428 for the next level. If this rally does not sustain, Rs. 324 would be the next down target. However, fresh purchases should be made at Rs. 360 and have a stop loss on this at Rs. 330.

Friday, November 10, 2006

IDFC - Stock To correct


IDFC was close to achieve its target last time in reaching 127% according to fibonacci levels last month. However, the stock since corrected and is trying once more to break this level this week. The stock is currently trading at Rs. 80.75 with a previous high of Rs. 83.50.
  • MACD has just about given a 'buy' call on this stock with the bullish line breaking the signal line
  • RSI is on the expensive side due to the increase in prices over the past couple of trading sessions
  • Accumulation Distribution chart is on the ascent. Hence, there looks like some more strength in this rally.
The stock could hit Rs. 84 or just about break Rs. 83.75 in the next trading sessions before we see a correction on the stock which is imminent at this point in time. Though the MACD has given a buy signal, I would not bank on it this time!

Thursday, November 09, 2006

Alpha Laval - First Target Achieved


Alfa Laval has achieved its first target. The stock traded past Rs. 910 and broke on decent volumes.
  • MACD on the charts is still giving a positive signal with the bullish lines slightly expanding. RSI is close to giving a 'sell' signal
  • The accumulation distribution line is seeing some strength, though it is not actually convincing
  • The stock when it fell from these levels last time had consolidated for sometime before falling further. So, one could expect the same if we see further upside on this stock.
Personally, this is not a favorite stock of mine and had bought it mainly because it was attractive on charts. However, I have come out of the stock today as I did not want to get into a stock that was this illiquid. The stock can be bought at Rs. 930 for a good buy with two targets of Rs. 952 and Rs. 1000 in mind. Downside on the stock is quite difficult but Rs. 780 levels is something that one can expect incase the fall is quite sharp.

BPCL - Stock in a hurry


BPCL was in hurry to correct over the past 4 trading sessions. The stock is reacting strongly on the price cuts that the Petroleum Minister Mr Murli Deora discussed a few days back. If this was true, this is giving an option to trade if the information does not actually materialises in the near future. Well, that is something for time to tell!
  • It is a wonderful double head formation. A good bearish sign! The only reason for it not being a proper formation would be the volumes. Volumes has risen with the price increase especially at its peak.
  • MACD has given a 'Sell' as the signal line for the stock has been breached.
Targets for this stock would be to watch until it breaches Rs. 360 on good volumes. Then the stock could further fall - a highly unlikely proposition unless the petrol minister comes out with a huge cut in prices, of which he is not comfortable with. At Rs.385, one can buy the stock with a first target at Rs. 396 and the second target at Rs. 420. Both these levels can be reached instantly with a change in the news on pricing of petrol!

Ashok Leyland - Broken Channel!


Ashok Leyland has broken a channel that was created in the past week. The stock broke the channel on strong volumes.
  • The Accumulation Distribution chart has shown a reversal from the fall that the stock has seen over the past few days
  • The stock has just beaten the segment where there could be some consolidation. This is the area where the rectangle has been marked during its previous rally
  • MACD is showing some strength and looks like it could give a 'buy' signal sometime soon
The stock has an upside at two levels to break before it hit Rs. 50. One will be at 46.7 and the other at 47.5 and if it breaks both these levels then we could see it hitting Rs. 50. These are levels that would give an investor an approximate return of 10% in the coming weeks. However, one must look at this channel break on the pessimistic view too considering the stock markets are making new highs with fewer stocks. I would still keep the previous levels as stop losses - Rs. 42 levels.

Tuesday, November 07, 2006

Bajaj Auto! Breathing Tough


Bajaj Auto results was the first trigger for the stock to see its price correcting. The stock crossed the 61.8% and 50% quite easily. The stock is now looking for some information to start the next phase. However, the following are some of the key issues to be noted.
  • Volumes on this chart has been growing over the past few days and the frontline auto stocks are seeing some erosion in their prices.
  • Accumulation Distribution chart is at a level where there is a high probability of the stock reaching new lows.
  • MACD charts are giving comfortable signals than the others. The column bars on the chart are decreasing. However, even here the bullish line has just seen a small expansion just when it was closing.
  • RSI is the feel good factor showing some signals that further downside could be limited in the stock
An upside for buying this stock could come if the price crosses Rs. 2910 convincingly and a downside for the stock would be Rs. 2630 as the first level and Rs. 2590 coming from the fibonacci charts as the second level. Given the higher downside on the stock than the upside, I would wait for some more time!

Monday, November 06, 2006

Wipro - Something Brewing!


Wipro is seeing a strong downside and this is quite strange compared to its peers. Though TCS has fallen too, the fall in Infosys or Satyam has not been this harsh as what it has been to Wipro. The stock just about covered the entire loss that it incurred in April this year. However the recent decline considering that it is yet to reach the movement enjoyed its peers has raised some doubts.
  • No change in the signal to 'buy' for Wipro from the MACD chart. The column bars are still increasing.
  • RSI is in the mid zone and no signal coming from this chart either.
  • The volume chart from Accumulation Distribution is probably the other place apart from MACD which suggest that there is still some strength in the downside.
  • A key point to note is that the levels at which the price is currently is a place where it has a strong support zone. Most of August and September this year, the stock has been hovering at this price.
All of this are suggesting that the chart for Wipro is not in a comfortable zone for investors who have just bought the stock. One could expect some languishing of the stock at these levels. Fresh exposure in this stock would come in at Rs. 520 levels only unless there is a strong reversal in the chart formation.

MTNL - Accumulation?


MTNL, as a company that I would always try to avoid as I am extremely uncomfortable with their style of functioning. The stock charts however is showing something that is pleasing to the eye. The stock has been falling in this bullish market. It looks to be an ideal hedge with limited losses and a good potential upside.

Though the stock has not given a clear "Buy", this looks to be an ideal place to start looking at the movement of the stock seriously. Any value buyer can start slowly accumulating the stock at these levels.
  • RSI is at its lowest levels, indicating a oversold stock in the past two weeks
  • MACD column bars has started reducing
  • However, there looks like no stopping on the decline of volumes. Selling is still active at these levels.
At the first strong resistance levels at 168, the stock has a potential upside of just more than 25%. The stock could see some consolidation happening at about Rs. 150 and even at this level the stock has a potential upside of around 18%.

For a patient investor, there is some money to be made in this stock. For a speculator, wait for sometime till there is some trend reversal!

Gammon - One on the Move


Gammon has finally started to rally. The stock has breached two important levels at 38% and 50% quite convincingly. The stock looks next support would be at Rs. 465. The volumes that has supported this section of the rally is quite strong. I would hold the stock at these levels.

Given that the incremental money that can be made at this stock is limited for investors who would want to enter this stock at this time (as the next trigger would give only 5% of profits), if it does reach that level, I would wait for sometime till it breaches at Rs. 480 for some fresh exposure to the stock as the next level of gains would be at Rs. 575, an upside of more than 20%.

Maruti - First Gear or Reverse!


Maruti has been struggling to move upwards since mid- september. The stock had a strong rally to hit its previous high, but things have not been as bright since then. The stock has been languishing at 960s and broke this level only twice in the past one month. Yesterday's break-out was not strong either.
  • The volumes are not encouraging as there is hardly any new buyers in this stock
  • MACD is close to giving a 'buy' signal currently. A signal for a 'buy' did occur once last month. However, the stock did not have the strength to move upwards. RSI is in a comfortable zone currently
If this stock has to breakout, any price above 1000 would be a good level to buy. However, the upside for the stock immediately would be around Rs. 1040-1050 giving a limited upside of only about 5%. However, any downside in the stock would be close to Rs. 900-920 with the next level at Rs. 855.

Sunday, November 05, 2006

Ashok Leyland - Consolidation


Ashok Leyland achieved its target of Rs. 50 in the second week of October. The stock has since seen a good correction of approximately 12%.
  • Though not a proper downward line formation, the stock looks to be following a nice trend on the downside. The upper and the lower lines on this stock gives an indication of the maximum expected movement on a daily basis. Given this formation the stock is all set to reach its first support levels of Rs. 43 in the next couple of days.
  • The MACD chart has supported this downward movement and the columns are still rising on the negative side. RSI is still not in a strong 'buy' zone for the stock.
  • The stock consolidates at certain levels and then takes a movement which is quite sharp. At both the 50% and the 61.8% levels, the stock did consolidate for a week or so, before the next rally.
  • Accumulation - Distribution chart is showing strong volumes on declines.
Given the above conditions, I would wait and start accumulating if the stock reaches Rs. 46 on the upper side and sell at Rs. 41 on the downside, if it is accompanied with strong volumes.

Friday, November 03, 2006

Patni Computers - Negative Breakout?

Patni Computers tried to hit its previous high of Rs. 506 in March last week before contracting back to its current levels. The stock achieved a maximum recovery of Rs. 493. The stock is now currently trading at Rs. 403, a discount of close to 20%. The fall has not been regular with a gap created in the fall. This gap could get covered in the near future, though covering is not a necessary criterion.
  • MACD is in a definite 'sell' zone and the column bars are still increasing giving some indication on the strength of the downside movement.
  • RSI is still on a comfortable zone even though it has not reached a definite 'buy' zone.
  • Accumulation Distribution chart gave a small indication of some fresh purchases on this stock at todays current levels. This is the only indicator on the buy side.
  • Fibonacci Chart has given one support levels at Rs. 409. The stock is currently marginally down from these levels. Incase it breaks the current price and falls to 385, we can see some further selling on this stock and the next support would be around Rs. 380. This is one level where the stock has extremely strong support. If the stock does turnaround and move upwards, then one level to look at would be to cover the gap between 433 and 450. So one can expect some resistance at this level before it inches upwards to Rs. 500 to break its March benchmark and reach 100% of its fibonacci retracement.
Hence those mentioned above would be the benchmarks to look at in this stock!