Dr. Reddys - Diverging Trends


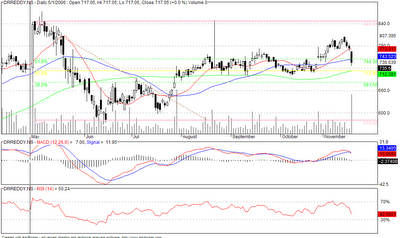
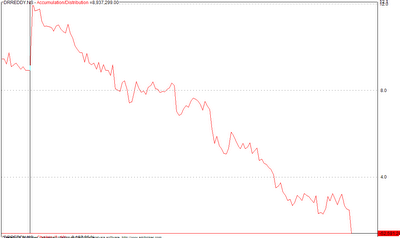
Dr. Reddys chart is probably one of the better stocks to look at to understand why volumes are needed for a sustainable rally. The stock has fell by over 35% since May and the stock has rallied by more than 30% since that fall. However, the most interesting is not in this chart but in the Accumulation Distribution chart. The stock has not been able to replicate the return on the volume chart. It has largely been falling in this market in spite two big changes in the price movements. Largely investors are existing out of this stock.
- MACD has given a 'sell' on the charts.
- RSI is falling drastically and is not a good sign at the pace of the fall in the technical side
On the upside, unless there is volume, the rally just cant sustain. Hence, this is a stock with immense potential but a wonderfullandmine in the stock.

0 Comments:
Post a Comment
<< Home