IDFC


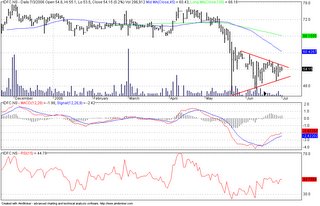
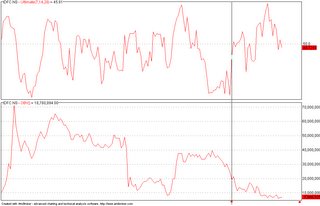
IDFC has entered into a symetrical triangle. This type of triangles are normally not indicative of the future trend until there is a clear breakout. The stock did a low of 45 on May 22 and then has entered into this triangle and since then RSI has shown some strength. As this does not take the volume under consideration, I have used the OBV indicator to define the strength of this movement within the triangle.
Also if one looks at the OBV, which is a volume indicator, it is pretty disappointing. The stock is seeing movement on reducing volumes... Buying has drastically reduced in this stock and infact is losing strength. At this point I would be a bit hesitant to take calls on the stock.
Lets see how this stock pans out in the near future.

2 Comments:
A look at YOUR OBV is also quite disappointing.
:-"
Payne
Sir i need intraday data from yahoo.
i know u hav it.
pls help me stocknse@gmail.com
Post a Comment
<< Home