IOB - Triangle Development


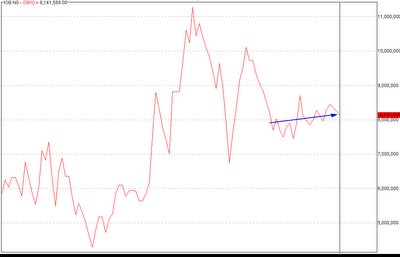
- In my previous article, I had mentioned that IOB was heading nowhere. The triangle on the lower trendline has been broken yesterday. However, this movement was not accompanied by volumes. Hence, for existing investors, this still does not look good. I would still prefer at looking at other stocks and look at this stock back at 86 levels, if the movement is strong. There is a lot of resistance that the stock is facing from the fibonacci point of view too as the stock is shown in the figure.
- For fresh investors, this stock will be a 'no', as the stock is trading on extremely low volumes. The stock has moved from its low of 65 to the current levels at 81, on very little volumes. This is represented in the OBV chart.


0 Comments:
Post a Comment
<< Home