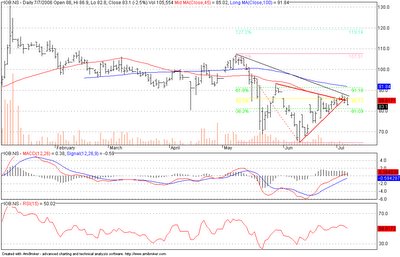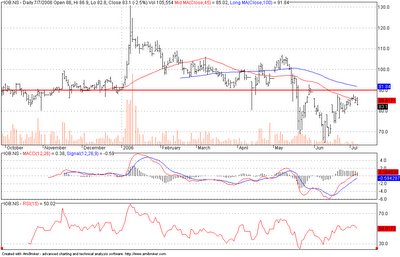


I have attached three charts on IOB.
- The first chart is the short term chart. The stock entered into a symetrical triangle and is not breaking significantly in any direction.
- The volumes on this chart is flat. Every rise is on extremely low additional purchases. The stock has moved from 65 last month to 83 this month with hardly any movement in OBV. This is not a good sign on the stock.
- The two lines on the MACD has shown some convergence which is not a good indicator, as the stock has seen a significant rally in the past.
- The medium chart also gives indication of resistance at 89-93.
Given the above condition, I would suggest a 'sell' for the existing holders and move on to other companies and a 'no' for investors who want to enter the stock afresh.


 I have attached three charts on IOB.
0 Comments:
Post a Comment
<< Home