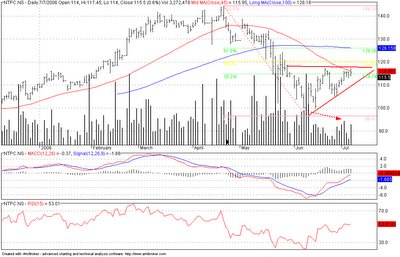

- NTPC is still is looking strong on the charts. An upwards sloping triangle with volumes inside the triangle being on the lower side is a strong indicator of it confirming to this triangle
- The MACD has still not given any signal for a change in strategy and the RSI is moving witht the trend and is at the mid-range at 53.01
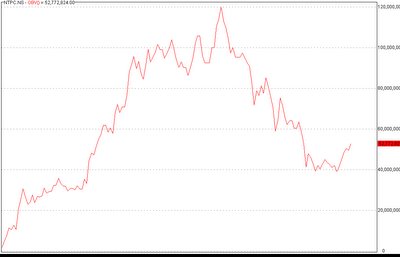
- Volumes are confirming with the price movement with every rise getting more purchases than in every fall
- Nothing conclusive on the fibonacci charts on this movement
Overall, there is some strength in this rally. A key factor to decide on selling would be it breaking 106-105 on the downside with strong volumes and the stock will see resistance at 114 and 120. However if it breaks these levels.


0 Comments:
Post a Comment
<< Home