IT Companies - Following Different Returns
Infosys, TCS and Wipro are following different price charts in this rally.
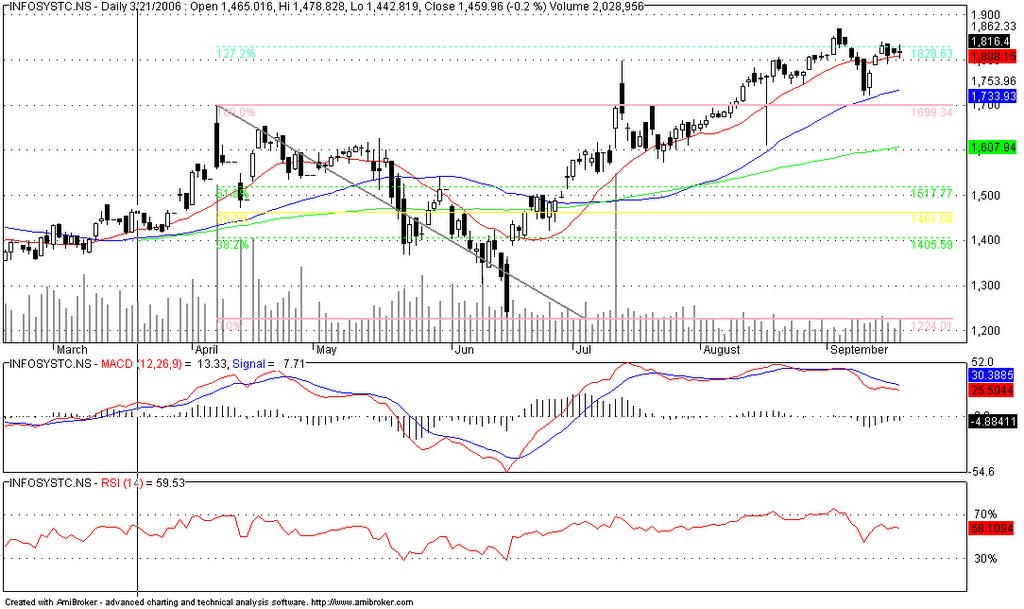
 Infosys has had a significant run in the past few weeks. The stock fell around 25% from its height of 1701 to 1224 before showing a strong rally to more than 1830. The strength over the past few weeks has been pretty low. However, the stock has strength to go past 2000 on the basis of the expected guidelines that it has given for the current year. However, it looks like the stock has time to get to those levels. On RSI charts, it is still not expensive. But as it goes, there looks like other charts to look at than buying this stock. Owners of this stock can hold it, with a little correction coming in the next correction in the market as it is followed by many analysts.
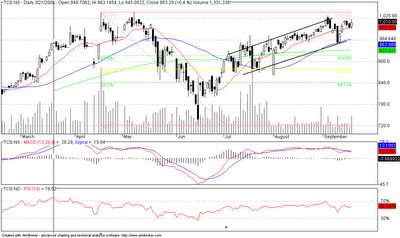 TCS is following close to Infosys. The stock has retraced the entire losses, of approximately 25%, that it gave to its investors :) in the recent crash. In terms of growth from these levels, there is a potential for it to follow the path of Infosys. RSI is slightly expensive than Wipro, but no definite signals from MACD. Even though MACD is not showing any signals, the OBV indicator is strong with purchases happening with every small correction. If it has to follow Infosys then there is an upside of 25% in the stock from current levels.
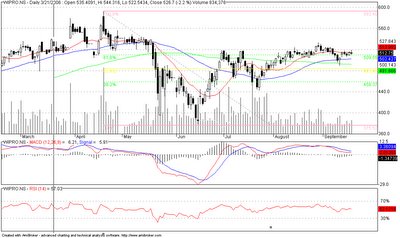
Wipro has been a laggard when compared to TCS and Infosys. The potential for further upside looks far more attractive on purely relative terms. The stock fell from a high of 592 to 375 before it retracted to 61.8% levels to 509. The stock is howering at that levels since end of June. The stock can give a potential upside of 20% with a downside support at 480. With respect to signals from other charts, MACD is showing first signs of divergence between column bars and the trend line. RSI is on a comfortable zone.
 Infosys has had a significant run in the past few weeks. The stock fell around 25% from its height of 1701 to 1224 before showing a strong rally to more than 1830. The strength over the past few weeks has been pretty low. However, the stock has strength to go past 2000 on the basis of the expected guidelines that it has given for the current year. However, it looks like the stock has time to get to those levels. On RSI charts, it is still not expensive. But as it goes, there looks like other charts to look at than buying this stock. Owners of this stock can hold it, with a little correction coming in the next correction in the market as it is followed by many analysts.
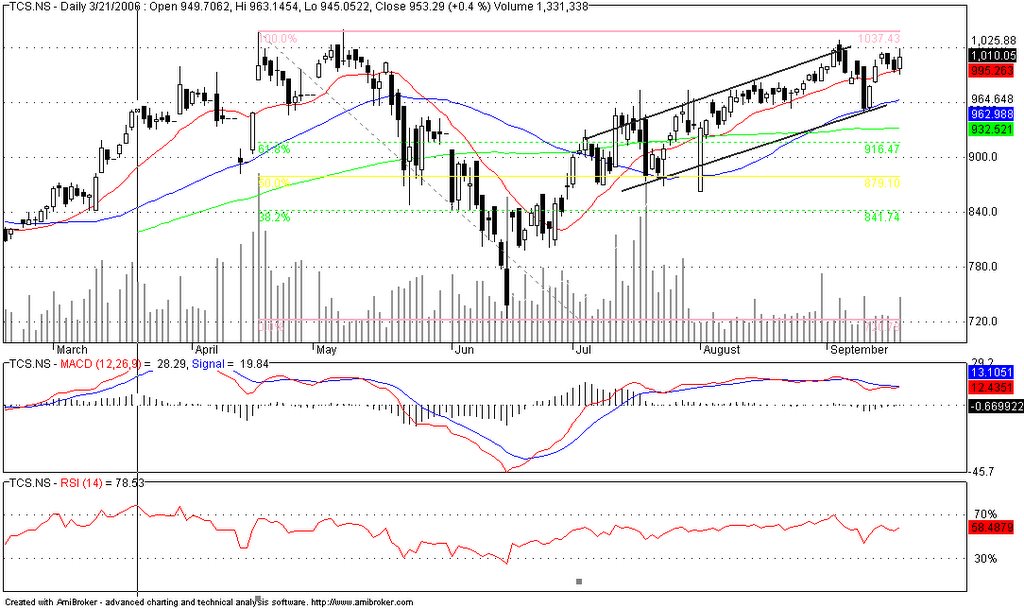 TCS is following close to Infosys. The stock has retraced the entire losses, of approximately 25%, that it gave to its investors :) in the recent crash. In terms of growth from these levels, there is a potential for it to follow the path of Infosys. RSI is slightly expensive than Wipro, but no definite signals from MACD. Even though MACD is not showing any signals, the OBV indicator is strong with purchases happening with every small correction. If it has to follow Infosys then there is an upside of 25% in the stock from current levels.
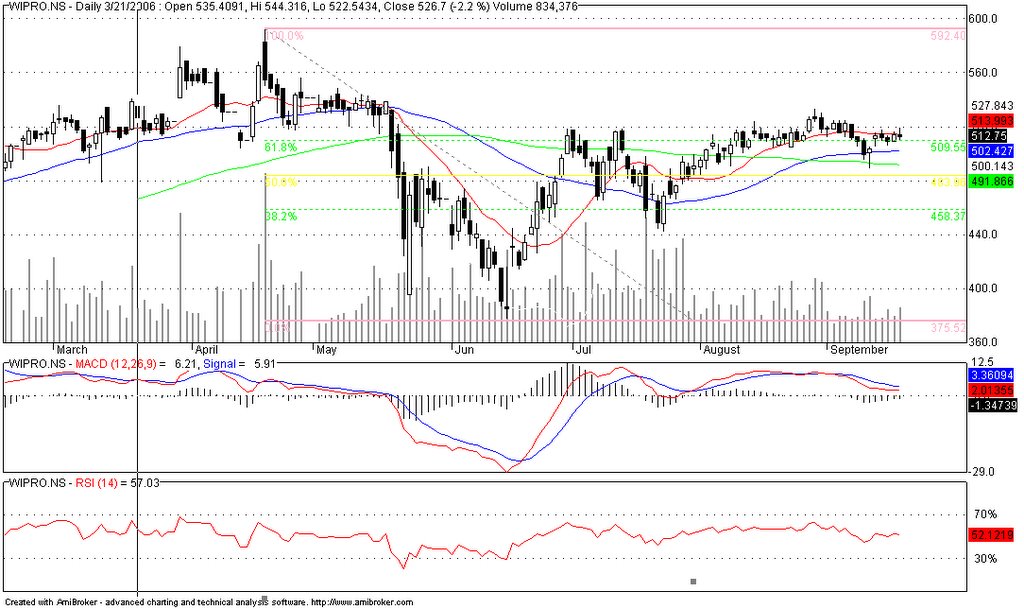
Wipro has been a laggard when compared to TCS and Infosys. The potential for further upside looks far more attractive on purely relative terms. The stock fell from a high of 592 to 375 before it retracted to 61.8% levels to 509. The stock is howering at that levels since end of June. The stock can give a potential upside of 20% with a downside support at 480. With respect to signals from other charts, MACD is showing first signs of divergence between column bars and the trend line. RSI is on a comfortable zone.
posted by M B Mahesh at 8:25 PM
![]()


0 Comments:
Post a Comment
<< Home