Union Bank of India - Profit Time

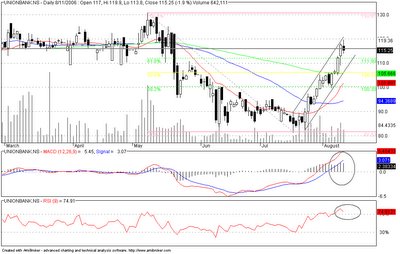
 Banking Sector has seen some movement in the past three weeks backed by some really strong buying. UBI has been one of the strong movers in this rally moving from 82 to 119 with almost very little correction.
The charts has entered into a nice phase to consolidate its gains. The reasons mentioned as follows
- The retracements for this stock from its high of 131 on 8th May to its low of 82 on 24th July and back has followed the fibonacci series with little correction at 50% and 38.2% levels. The stock cleared 61.8% with a 9% jump, however, if there is a correction, then 111 will be the first level to be breach to define the next support point.
- Volumes showed the first divergence (OBV chart)
- There is a channel range in the long term for this chart at 110 to 120. The stock is currently trading at these levels.
- RSI has crossed 70 and the stock has corrected at these levels in the previous two instances it has touched these levels. RSI has shown divergence to the current movement of the stock
- RSI and MACD have shown difference in sign. MACD is still on buy zone with the only indication coming from the column bards

0 Comments:
Post a Comment
<< Home