Wednesday, January 24, 2007

Havells - A downturn


Havells had a very good run from July last year. The stock has more than doubled in this period. Infact the stock has moved quite rapidly in the past few days. However, the stock is seeing some correction in the market now. The stock surged 20% in one single trading day on strong volumes. Since then, the stock has seen some correction.
  • MACD is close to giving a 'sell' signal and the column bars are reducing
  • RSI is still in the zone of expensive. Though, the stock is still yet to give a signal of 'overbought'
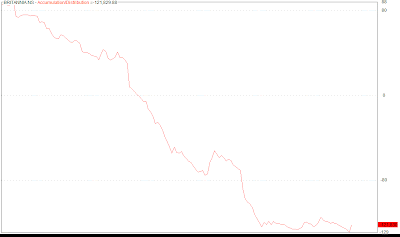
  • The stock needs to be looked at in the Accumulation Distribution segment. The stock's volume is increasing rapidly and causing a deep fall in the market.
The stock is in a comfortable margin over the 200 day average. Hence, still not a problem. However, these are the following stop losses : Rs. 417 on the lower side and Rs. 471 on the higher side. Given the negative break out in the stock, look till this stabilises. One note of concern: This is a volatile stock and revaluation is too quick and sharp.

Wednesday, January 17, 2007

Ashok Leyland - Technical Update


Ashok Leyland is entering into a nice triangle. The triangle however has mostly entered into a phase of "no clear signal" zone. The volumes are not clear for defining a clear triangle.
  • The zone has entered into a nice resistance zone at this current level. This is the third time that it has reached this level.
  • MACD is still on the positive zone. The column bars are still giving any indication or signal for a reversal of trend.
  • RSI is still at high 60s. The last time we had correction at this level.
  • Accumulation and Distribution chart is still on the upmove. The last few weeks is showing some resistance on the volume charts too.
  • The stock is comfortably above the 200 and 100 day moving average.
Given the current stock levels, it is important for it to break Rs. 47. If it breaks this level, then it can break Rs. 50 else it can get back to Rs. 45-44.

Arvind Mills - Not a strong movement


Arvind Mills is running under some really tough times. The stock has seen some revival over the past couple of days. After reaching an 52 week low at Rs. 45, the stock is currently trading at Rs. 57. One of the FIIs had taken a big stake at these levels last time.
  • The stock is currently trading below its 100 and 200 day moving average.
  • MACD is still on the positive zone. Though the signal line is trading almost parallely.
  • The stock is seeing some significant volumes. However, when one looks at the Accumulation Distribution, the story is a bit different. The rally is mostly on the downside for this stock.
  • Given the recent rise in this stock, RSI is on the higher side at close to 70.
The two important factor to enter into this stock would be fresh buying indicated by Accumulation Distribution chart for this stock. Some of the intermediate triggers would be at 59 and 62. These are levels which the stock found it difficult to break in July last year. Post this, breaking the 200 day average would be the next target. The downside would still be at Rs.51 and then at Rs. 48.

Sunday, January 07, 2007

Brittania - Stock to Watch


Some of the technical understanding on the stock at current levels
  • The accumulation and distribution chart shows a small uptick in the recent small channel movement in the price. However, the last trading day has seen a huge block of shares shifting to another investor.
  • The stock is still trading just below its 200 day moving average.
  • MACD is showing no strong signal for a 'buy' or 'sell'
  • RSI is still in a comfortable zone at 46
Given nothing impressive on this chart, what is exciting in this stock! Brittania is one stock that I am looking to accumulate in the new future. A wonderful stock (given the sheer strength of its distribution network and its strong product portfolio) that is now under some confusion on its management giving a good opportunity for investors into this stock.

The volume chart is indicating some stability at these levels given the price and accumulation distribution chart movement.


However, here are some key lookouts for the stock. Accumulate the stock at these lower levels which is less than 1120-1150 and look out for some breakouts at 1200 and have targets on the upper side at Rs. 1500. This is one stock for a long term and not for technicals :)

Saturday, January 06, 2007

BPCL - Strange run


BPCL is making some smart moves in the recent rally. Some of the interesting facts in this move.

  • MACD is still in the 'buy' zone. The column bars are increasing and hence there looks like some more room for the rally.
  • RSI, due to the recent rally, is moving towards the range of 60. A good reason for investors to be cautious.
  • The most important part of the chart for BPCL is in the Accumulation and Distribution section. There are more number of shares that is getting sold than being bought. Oil has seen some correction over the past couple of days. However, given the price reduction, there is still some more room for loss in selling oil.
  • The stock is at its 200 day average and there is a big chance of it being broken
  • The stock has met a resistance at this level last time in July.
Overall, the stock is something that I would avoid given the huge volatality in oil prices. However, interested investors could look at targets of 372 on the upper side and downside support at about Rs. 320.